The Streaming dashboard gives you an overview of a connected cluster, which has Jet enabled.
The following subsections describe each section of the page.
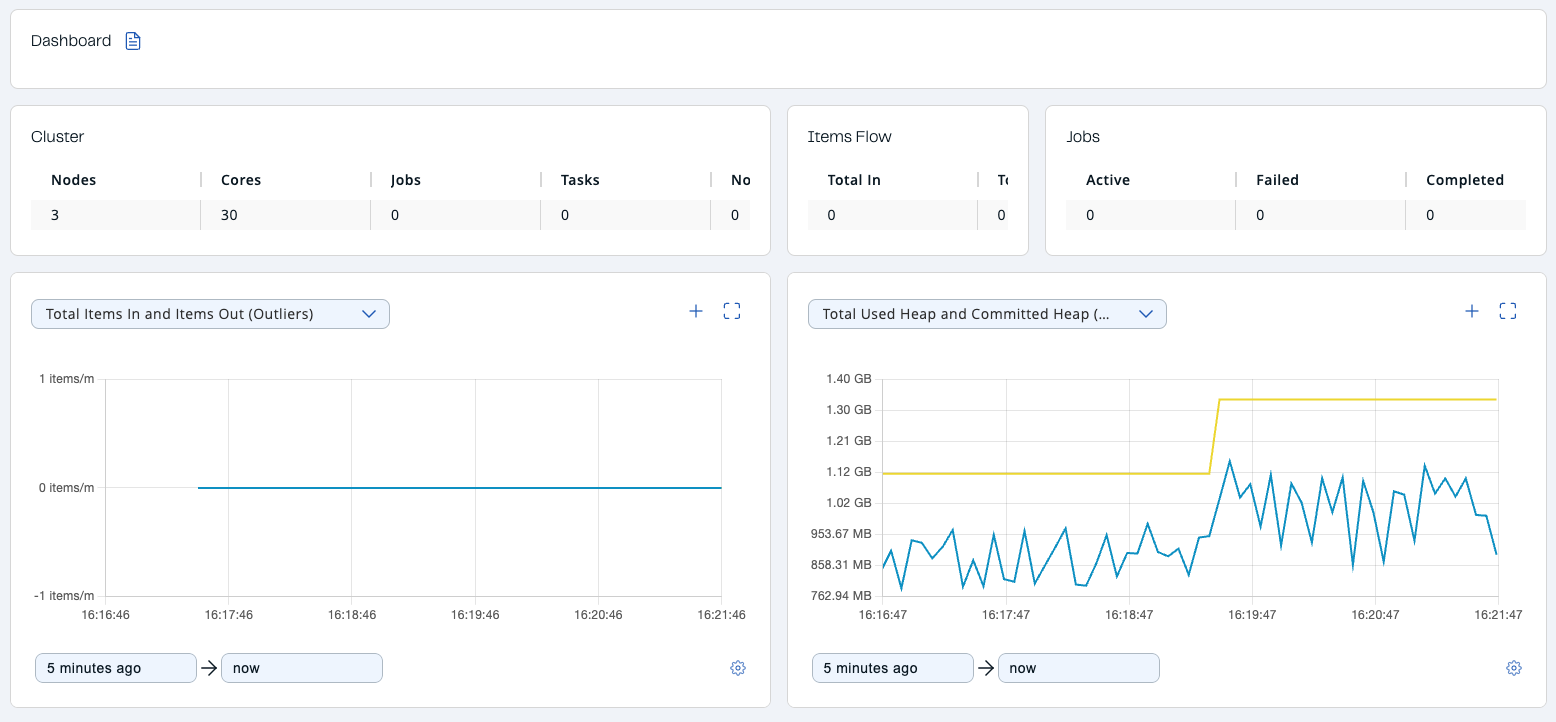
Cluster
Shows a summary of the cluster by providing the following metrics:
-
Nodes: Number of cluster members.
-
Cores: Number of available CPU cores in the cluster reported by the JVM.
-
Jobs: Number of jobs in the cluster.
-
Tasks: Number of cooperative tasks in the cluster. See 5.6@hazelcast:architecture:distributed-computing.adoc#tasks-concurrency-is-cooperative for more detailed explanation.
-
Non-cooperative Tasks: Number of non-cooperative tasks in the cluster. See 5.6@hazelcast:architecture:distributed-computing.adoc#tasks-concurrency-is-cooperative for more detailed explanation.