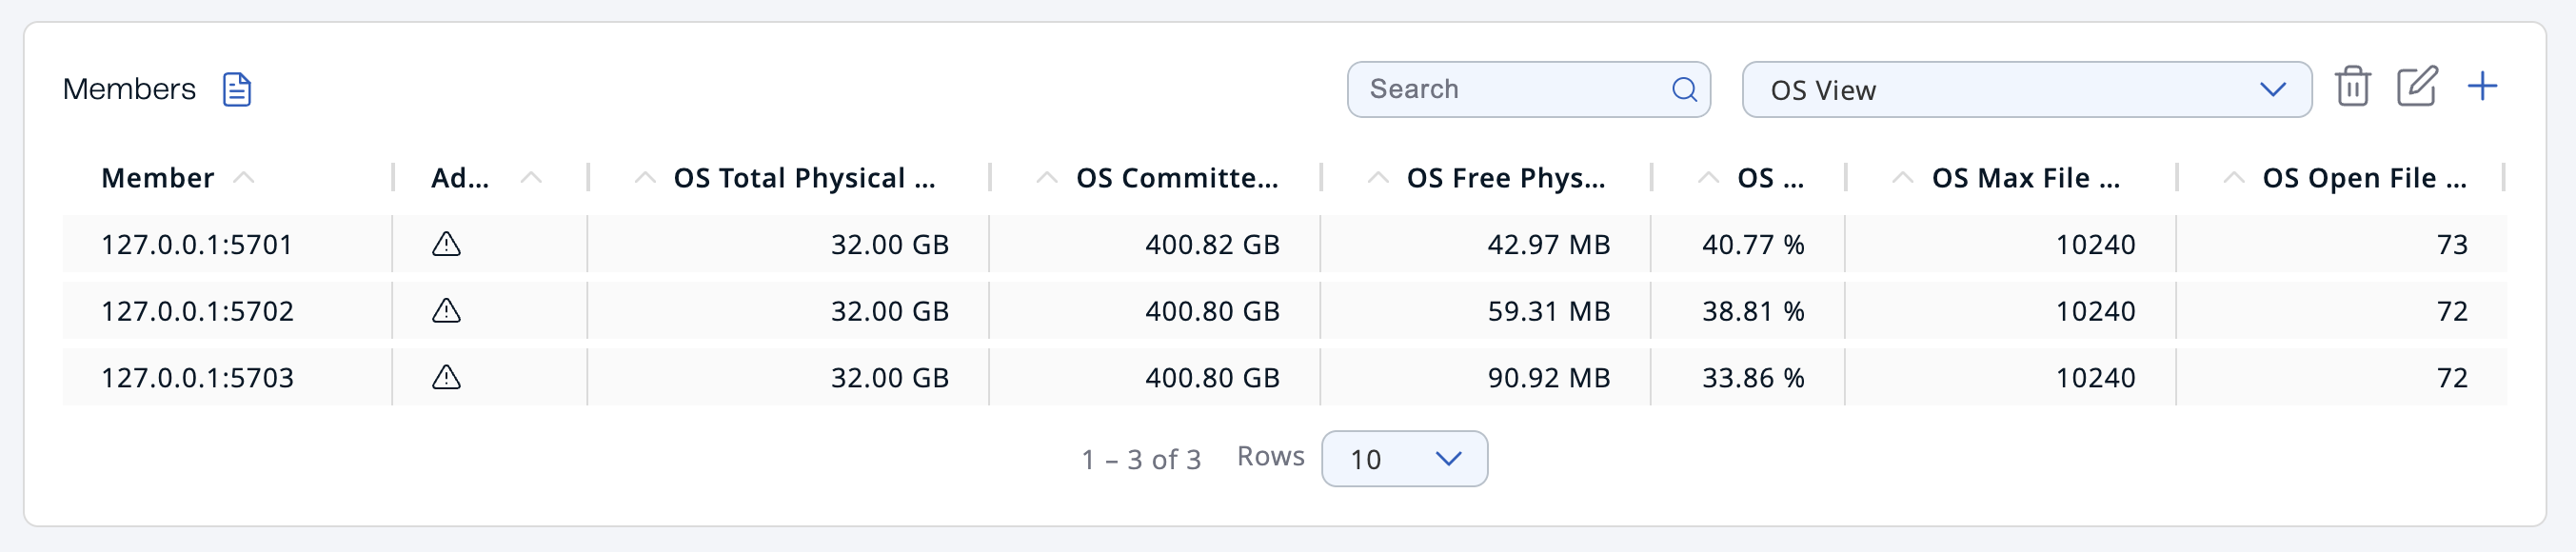
You can use the Members menu item to monitor each member in a cluster and perform management operations on any member such as running garbage collection (GC), taking a thread dump, and shutting it down.
| Field | Description |
|---|---|
Member |
The IP address and port of the member. |
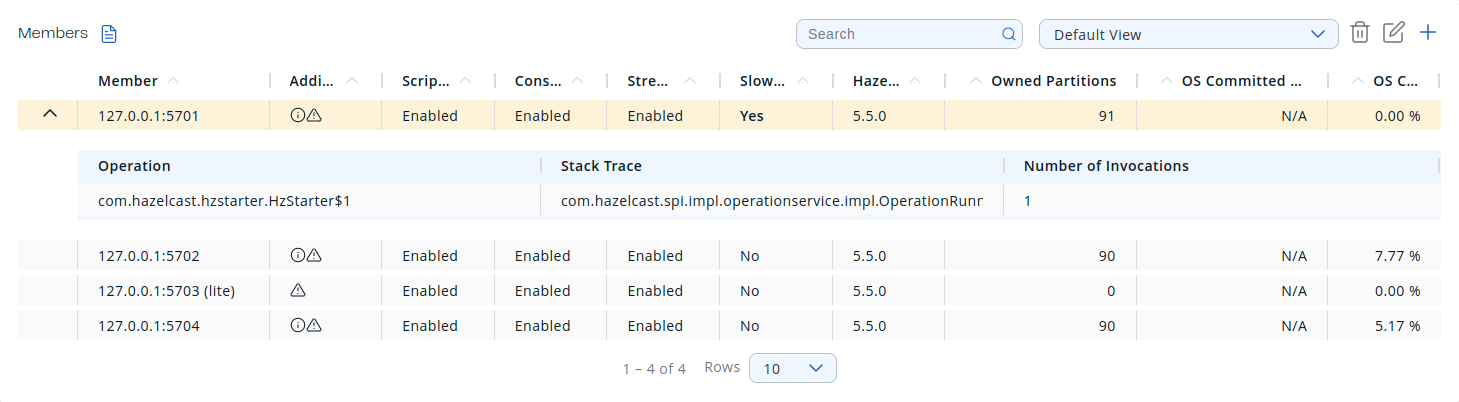
Additional Info |
Displays an info icon if the member is a CP member or a warning icon if the member’s runtime or hardware setup does not conform to our production recommendations. Hover over the icon to see the tooltip. For a list of production recommendations, see Best practices in the Platform documentation. To monitor and manage the CP subsystem, see CP Subsystem. |
Scripting |
Whether scripting is enabled. See Scripting |
Streaming |
Whether the Jet engine is enabled. See Configuring the Jet Engine in the Platform documentation. |
Slow Operations |
Whether the member has detected slow operations. See Slow Operations on this page. |
Hazelcast Version |
Version of the member codebase that the member is running. |
Owned Partitions |
Number of partitions that are owned by the member. |
OS Total Physical Memory |
Total amount of physical memory on the member. |
OS Committed Virtual Memory |
Amount of virtual memory that is guaranteed to be available to the running member. |
OS Free Physical Memory |
Amount of free physical memory on the member. |
OS CPU Load |
Recent CPU usage for the whole system represented as a percentage value.
0% means that all CPUs were idle during the recent period of time
observed, while |
OS Max File Desc |
Maximum number of file descriptors. File descriptor is an integer number that uniquely represents an opened file in the operating system. |
OS Open File Desc |
Number of open file descriptors. |
Filter members
To filter the displayed members, use the Search bar in the right-hand corner.
To sort the table, click on the column headers.
View details about a member
To see more details about a particular member, click on the member’s row in the table.
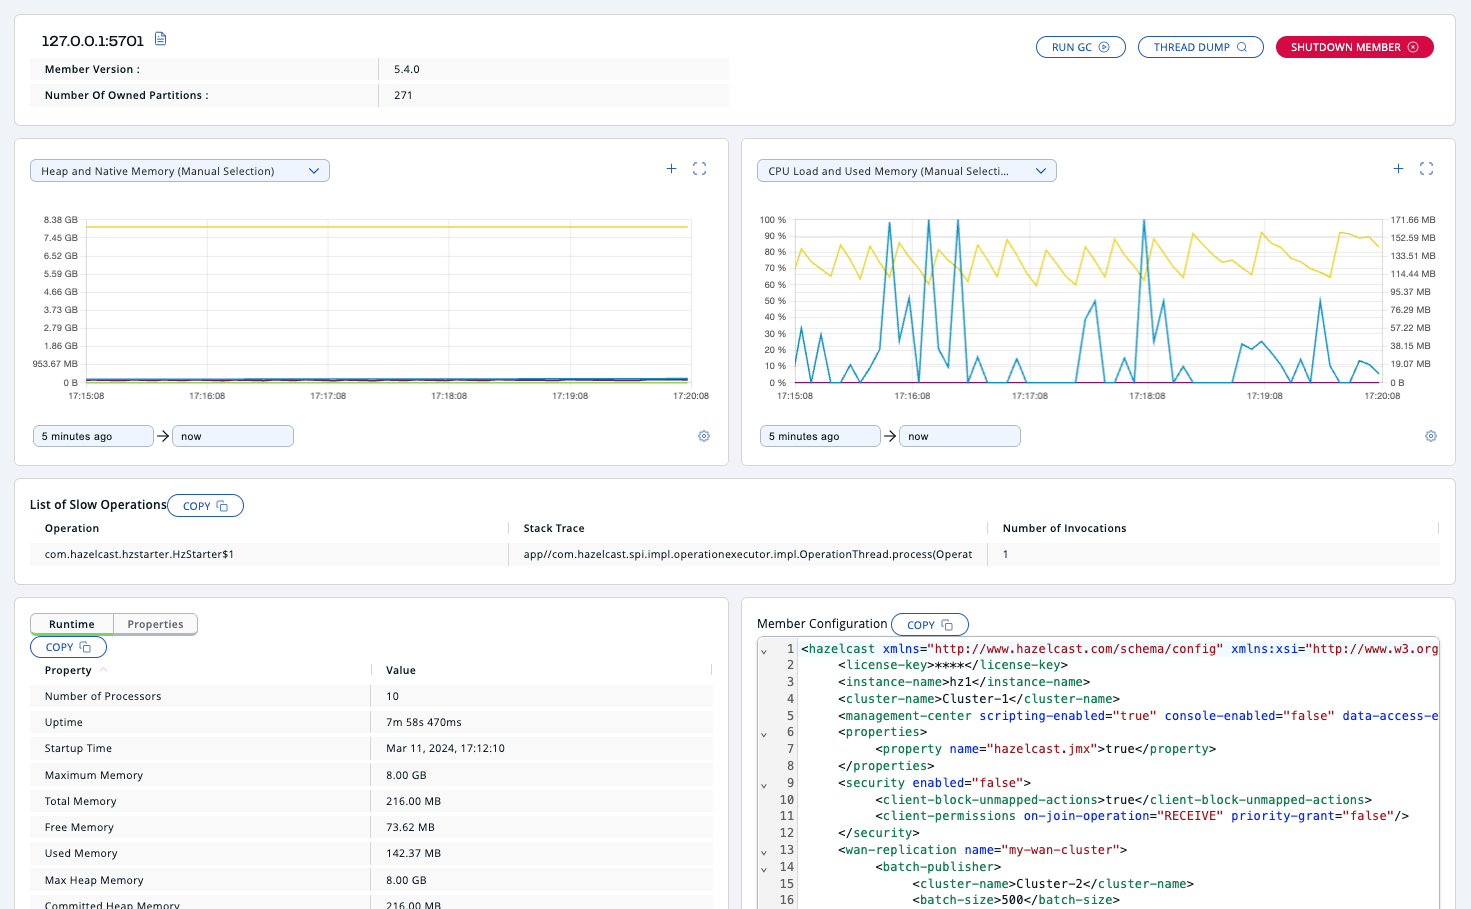
Actions
On each member, you can trigger the following actions:
-
Run GC: Executes garbage collection on the selected member. A notification stating that the GC execution was successful is shown.
-
Thread Dump: Takes a thread dump of the selected member and shows it in a separate dialog.
-
Shutdown Member: Shuts down the selected member.
-
Promote Member: If the member is a lite member, this button promotes it to a data member.
-
Demote Member: If the member is a data member, this button demotes it to a lite member.
The following conditions must be met to demote a data member:-
The cluster must be in the Active state.
-
The cluster version must be 5.4 or higher.
-
The member version must be 5.5 or higher.
-
The member must not be the only data member in the cluster.
-
| Demoting a data member to a lite member may cause data loss. Make sure you are fully aware of the potential consequences and have taken appropriate measures before proceeding. |
Graphs
The Heap and Native Memory chart shows the percentage
of CPU usage on the selected member. The CPU Load and Used Memory chart shows the memory usage on the
selected member. You can open
each chart as a separate dialog using
the maximize button 
To customize the data displayed in the graphs, see Graphs
Runtime
Runtime is a dynamically updated window tab showing the processor number, the start and up times, and the maximum, total and free memory sizes of the selected member. These values are collected from the default MXBeans in the Java Virtual Machine (JVM).
| These descriptions may vary according to the JVM version or vendor. |
| Field | Description |
|---|---|
Number of Processors |
Number of processors available to the member (JVM). |
Uptime |
Uptime of the member (JVM). |
Startup Time |
Startup time of the member (JVM). |
Maximum Memory |
Maximum amount of memory that the member (JVM) will attempt to use. |
Total Memory |
Amount of total memory in the member (JVM). |
Free Memory |
Amount of free memory in the member (JVM). |
Used Memory |
Amount of used memory by the member (JVM). |
Max Heap Memory |
Maximum amount of memory that can be used for memory management. |
Committed Heap Memory |
Amount of committed heap memory from the member. |
Free Heap Memory |
Amount of free heap memory of the member. |
Used Heap Memory |
Amount of used heap memory of the member. |
Max Native Memory |
Maximum native memory that can be used for memory management. |
Committed Native Memory |
Amount of committed native memory from the member. |
Free Native Memory |
Amount of free native memory of the member. |
Used Native Memory |
Amount of used native memory by the member. |
Total Loaded Classes |
Total number of classes that have been loaded since the member (JVM) has started execution. |
Current Loaded Classes |
Number of classes that are currently loaded in the member (JVM). |
Unloaded Classes |
Total number of classes unloaded since the member (JVM) has started execution. |
Active Thread Count |
Current number of live threads including both daemon and non-daemon threads. |
Peak Thread Count |
Peak live thread count since the member (JVM) started or peak was reset. |
Daemon Thread Count |
Current number of live daemon threads. |
OS Free Physical Memory |
Amount of free physical memory. |
OS Committed Virtual Memory |
Amount of virtual memory that is guaranteed to be available to the running process. |
OS Total Physical Memory |
Total amount of physical memory. |
OS Free Swap Space |
Amount of free swap space. Swap space is used when the amount of physical memory (RAM) is full. If the system needs more memory resources and the RAM is full, inactive pages in memory are moved to the swap space. |
OS Total Swap Space |
Total amount of swap space. |
OS Maximum File Descriptor Count |
Maximum number of file descriptors. File descriptor is an integer number that uniquely represents an opened file in the operating system. |
OS Open File Descriptor Count |
Number of open file descriptors. |
OS Process CPU Time |
CPU time used by the process on which the member (JVM) is running. |
OS System CPU Load |
Recent CPU usage for the whole system represented as a percentage value. 0% means that all CPUs were idle during the recent period of time observed, while 100% means that all CPUs were actively running during the recent period being observed. |
OS System Load Average |
System load average for the last minute. The system load average is the average over a period of time of this sum: (the number of runnable entities queued to the available processors) + (the number of runnable entities running on the available processors). The way in which the load average is calculated is operating system specific but it is typically a damped time-dependent average. |
Member configuration
Management Center receives the member configuration in XML format. As a result, even if you used a different configuration format such as YAML, it will be displayed in XML.
To view a member’s configuration:
-
Click a member’s row in the table.
-
Scroll down to Member Configuration at the bottom of the page.
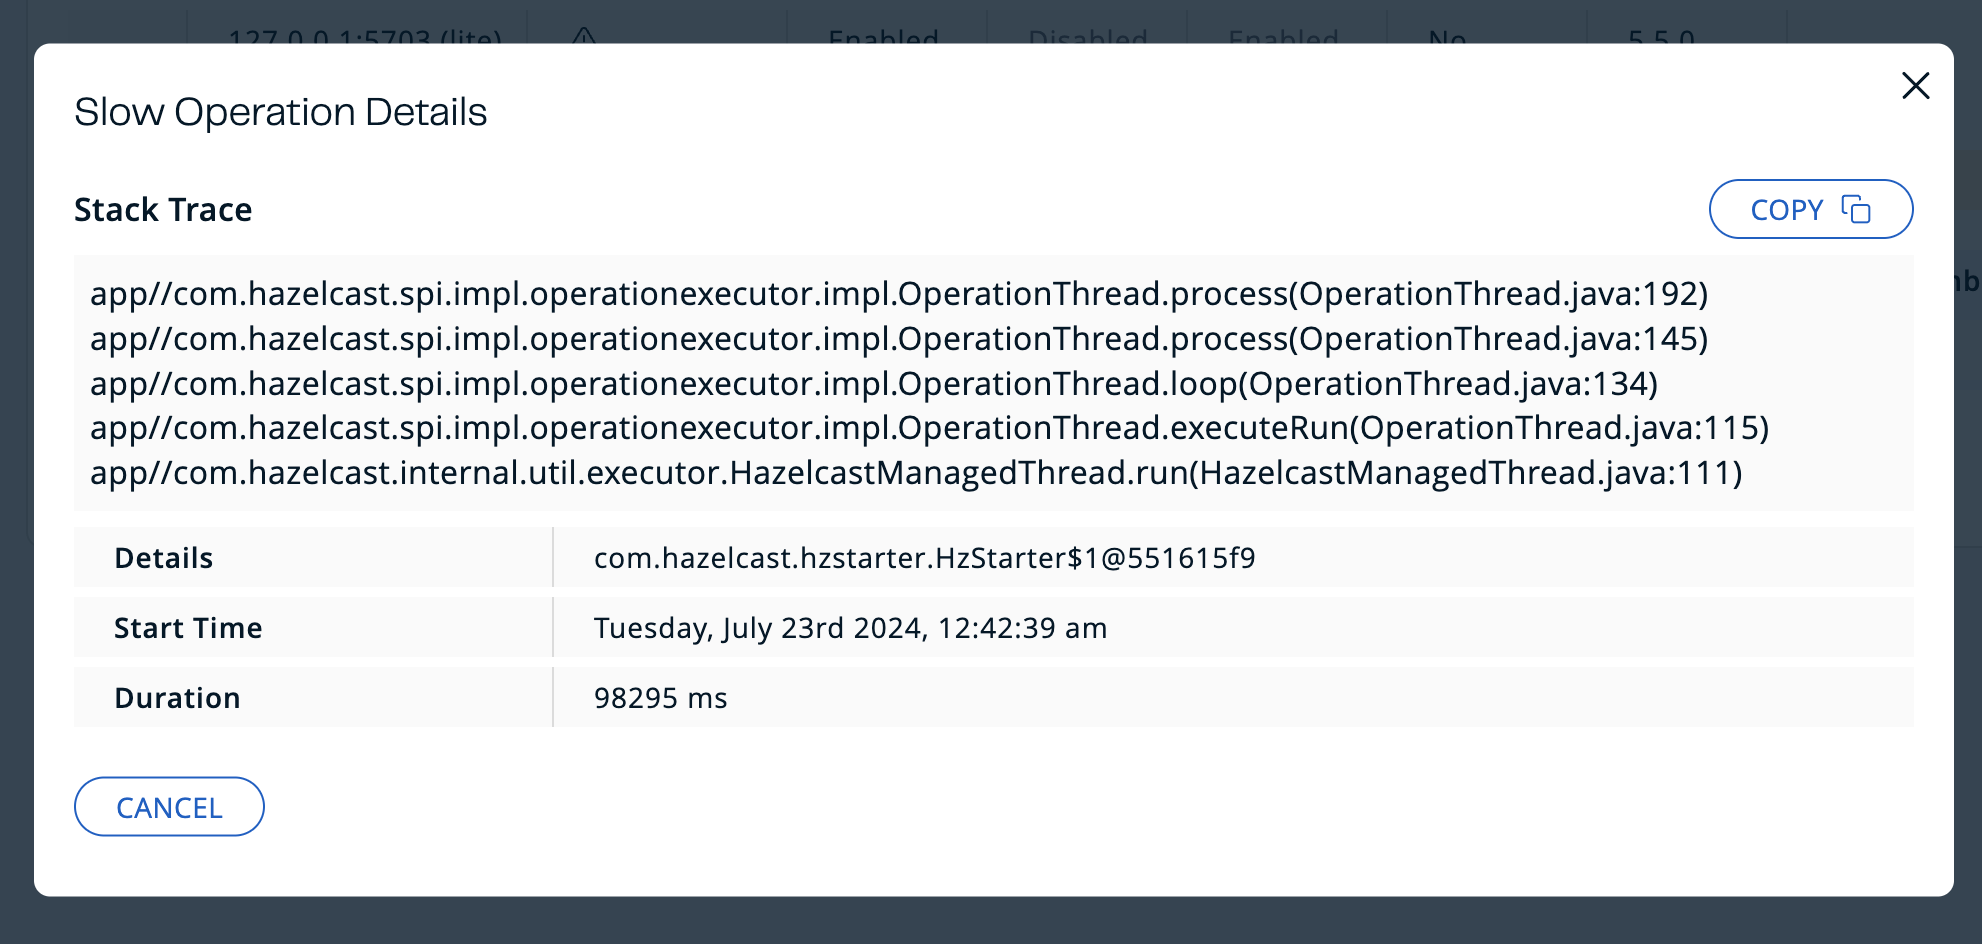
Slow operations
If a member has slow operations, you can view the detected slow operations which occurred on that member. The data is collected by the SlowOperationDetector.
The sidebar navigation item provides notifications about existing members with slow operations. A tooltip displays the total count of members with slow operations.

To view slow operations for a member:
-
Click the expand button to the left of a member’s row in the table.
-
Click on an entry in the List of Slow Operations table.
Clock synchronization
Any time difference greater than one minute between the Management Center and a member can cause synchronization issues, delayed responses or data loss. To prevent such issues, Management Center would report the members that have such time differences to the user.
You can view the detected members in the warning notification that is positioned just below the Top Bar.
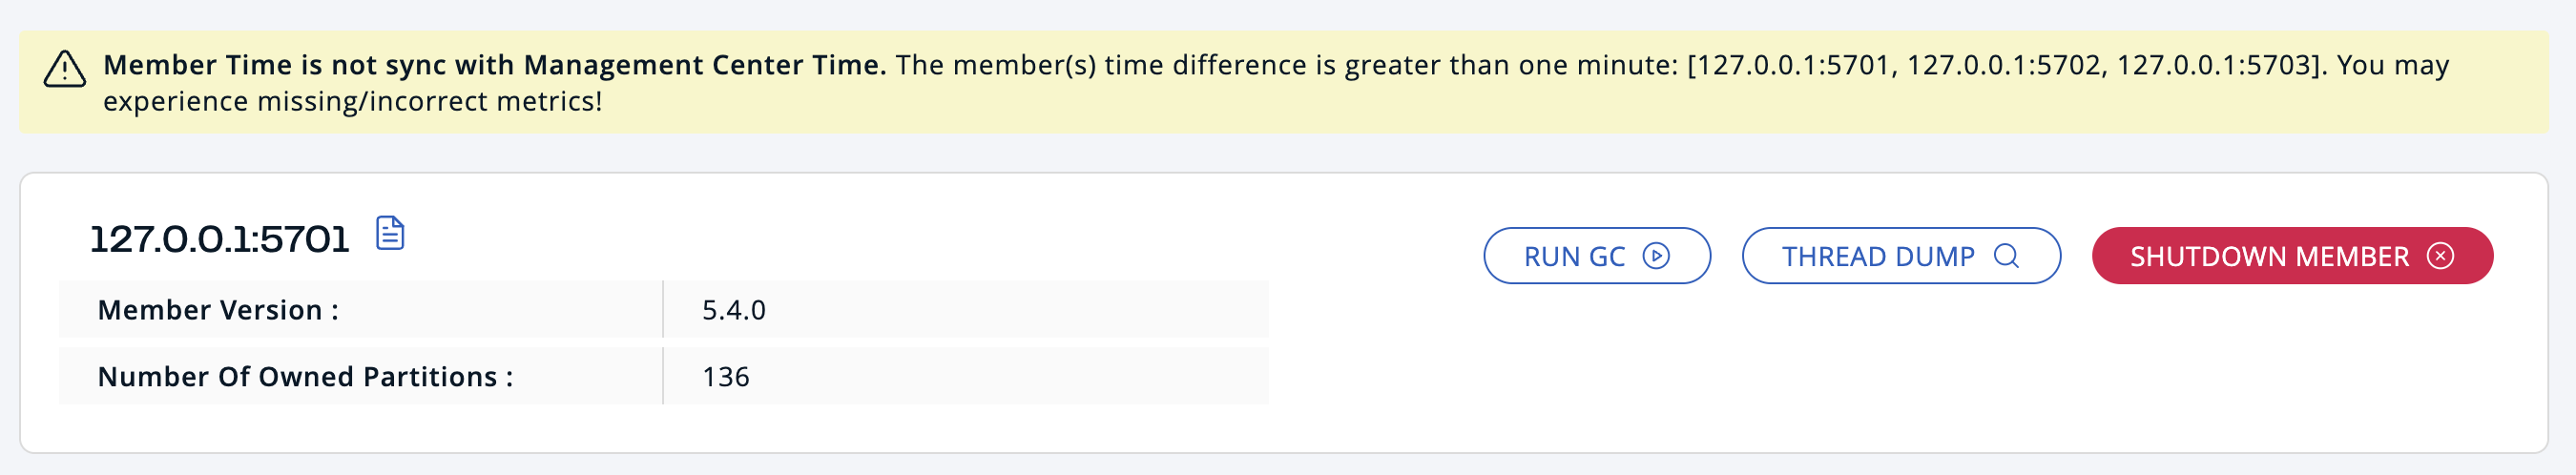
We recommended you synchronize the Management Center JVM clock with the clocks of the members in the cluster to ensure consistent time. Clock synchronization can help to promote optimal performance and proper communication.