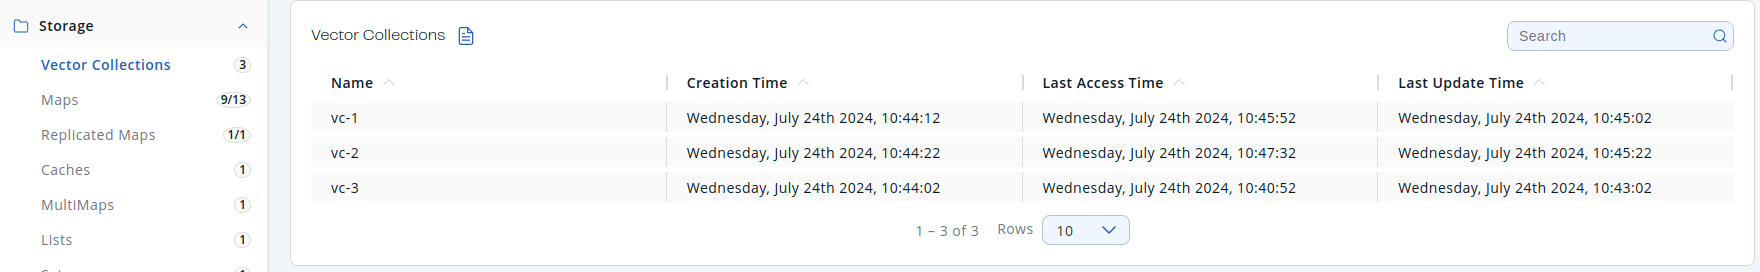
You can see a list of all the vector collections in your cluster by clicking on the Vector Collections menu item on the left panel. A new page appears on the right, as shown below.
| Field | Description |
|---|---|
Name |
Name of vector collection. |
Creation Time |
First time the key was put. |
Last Access Time |
Last time the clients read the key’s value. |
Last Update Time |
Last time the key’s value was updated. |
You can filter and sort the displayed vector collections by clicking on the column headers. Click on a vector collection name to open a new page for monitoring that vector collection instance on the right, as shown below.
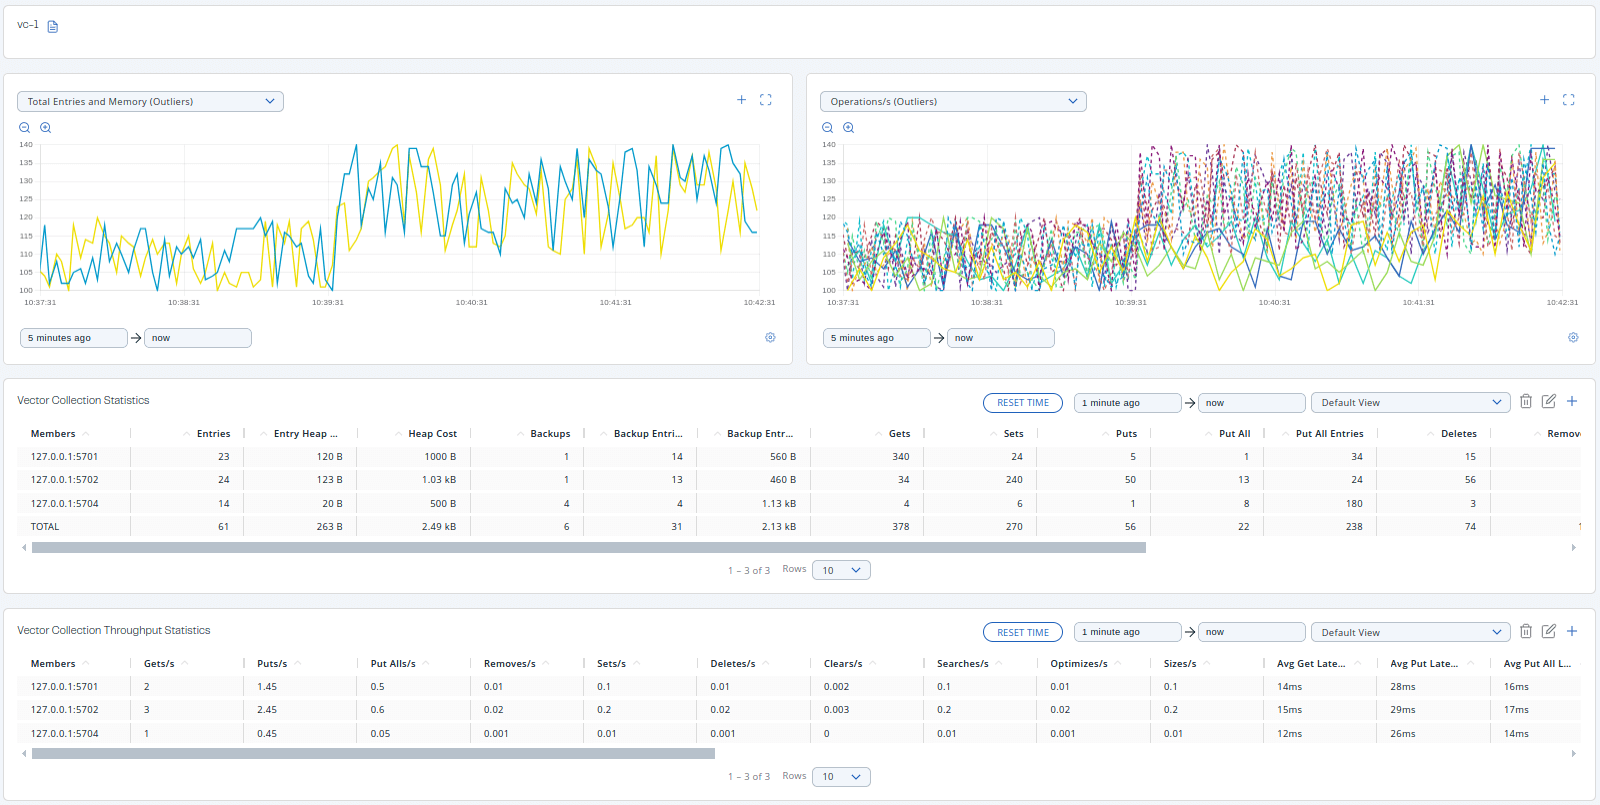
Monitor a vector collection
The vector collection monitoring page shows two graphs that display various metrics for the vector collection. For more information, see Graphs.
Under these charts are Vector Collection Statistics and Vector Collection Throughput data tables.
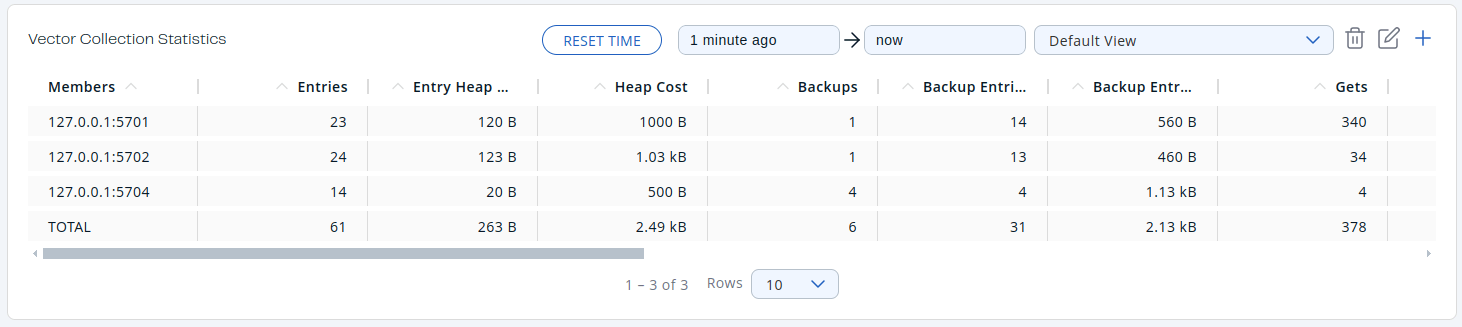
From left to right, this table lists the following:
| Field | Description |
|---|---|
Members |
IP address and port of the member. |
Entries |
Number of entries owned by the member. |
Entry Heap Memory |
Memory heap cost of owned entries in the member. |
Heap Cost |
Memory cost of owned entries in the member. |
Backups |
Number of backup operations held by the member. |
Backup Entries |
Number of backup entries held by the member. |
Backup Entry Heap Memory Cost |
Memory heap cost of owned entries in the backup. |
Gets |
Number of get operations received by the member. |
Sets |
Number of set operations received by the member. |
Puts |
Number of put operations received by the member. |
Put All |
Number of put all operations received by the member. |
Put All Entries |
Number of put all entries received by the member. |
Deletes |
Number of delete operations received by the member. |
Removes |
Number of remove operations received by the member. |
Clears |
Number of clear operations received by the member. |
Optimizes |
Number of optimize operations received by the member. |
Sizes |
Number of size operations received by the member. |
Searches |
Number of search operations received by the member. |
Search Results |
Number of search results. |
To display the list in ascending or descending order, click on the column headings.
Vector Collection Throughput Table provides information about the operations (get, put, remove) performed on each member in the vector collection, as shown below.
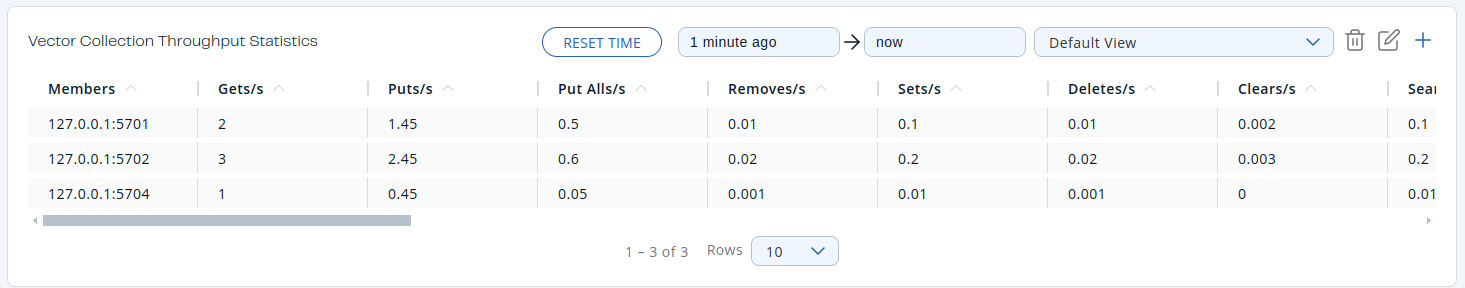
From left to right, this table lists the following:
| Field | Description |
|---|---|
Members |
IP address and port of the member. |
Gets/s |
Number of get operations per second on the member. |
Puts/s |
Number of put operations per second on the member. |
Put Alls/s |
Number of put all operations per second on the member. |
Removes/s |
Number of remove operations per second on the member. |
Sets/s |
Number of local set operations per second on the member. |
Deletes/s |
Number of delete operations per second on the member. |
Clears/s |
Number of clear operations per second on the member. |
Searches/s |
Number of search operations per second on the member. |
Optimizes/s |
Number of optimize operations per second on the member. |
Sizes/s |
Number of size operations per second on the member. |
Avg Get Latency |
Average latency of get operations on the member. |
Avg Put Latency |
Average latency of put operations on the member. |
Avg Put All Latency |
Average latency of put all operations on the member. |
Avg Remove Latency |
Average latency of remove operations on the member. |
Avg Set Latency |
Average latency of set operations on the member. |
Avg Delete Latency |
Average latency of delete operations on the member. |
Avg Clear Latency |
Average latency of clear operations on the member. |
Avg Search Latency |
Average latency of search operations on the member. |
Avg Optimize Latency |
Average latency of optimize operations on the member. |
Avg Size Latency |
Average latency of size operations on the member. |
Max Avg Get Latency |
Maximum Average latency of get operations on the member. |
Max Avg Put Latency |
Maximum Average latency of put operations on the member. |
Max Avg Put All Latency |
Maximum Average latency of put all operations on the member. |
Max Avg Remove Latency |
Maximum Average latency of remove operations on the member. |
Max Avg Set Latency |
Maximum Average latency of set operations on the member. |
Max Avg Delete Latency |
Maximum Average latency of delete operations on the member. |
Max Avg Clear Latency |
Maximum Average latency of clear operations on the member. |
Max Avg Search Latency |
Maximum Average latency of search operations on the member. |
Max Avg Optimize Latency |
Maximum Average latency of optimize operations on the member. |
Max Avg Size Latency |
Maximum Average latency of size operations on the member. |
Select the time period for the table using the combo box in the top right corner of the window:
-
Since Beginning
-
Last Minute
-
Last 10 Minutes
-
Last 1 Hour
To display entries in ascending or descending order, click on the appropriate column heading.