Tables are displayed within the dashboard and on the details page of most data structures. This topic explains how to read tables and customize their settings, including the columns shown.
Current and historical metrics
Tables work in two modes: current and historical. In the current mode, currently live metrics are shown from the cluster. The historical mode offers previously persisted metrics allowing the tables to show metrics back in time.
The current mode is always available for the connected cluster. The historical mode requires Historical metrics to be enabled and persists metrics for the Time to live (TTL) expiry period configured within the Metrics Persistence settings.
To see the current metrics view, press RESET TIME. To switch to the historical mode, click on the field labelled as Now, which opens the time selector:
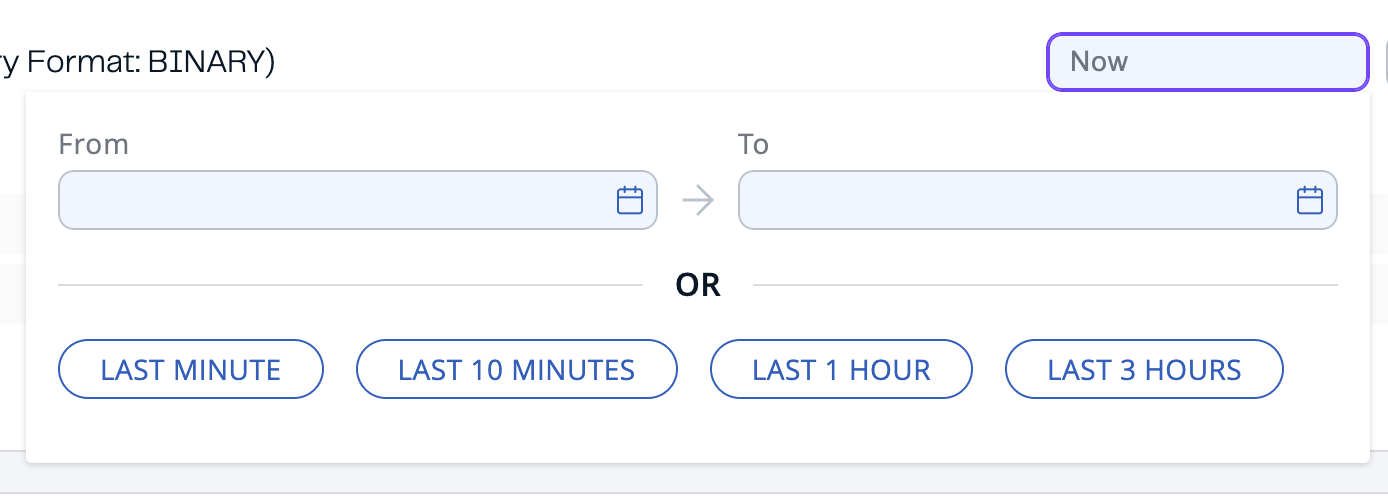
You can set the time range of metrics shown by either providing times using the From and To input fields or selecting a preset range using one of the LAST … buttons. In the historical mode, the time input fields show the active time range limit. If Historical metrics is disabled, then the time range fields will be disabled, showing only the current metrics.
Tables, by default, show the last minute of metrics. In the current mode, metrics are requested in chunks every 5 seconds. The metrics that have been persisted can be requested in historical mode as long as they have been previously recorded and within the TTL expiry period (defaults to 1 day).
Presets
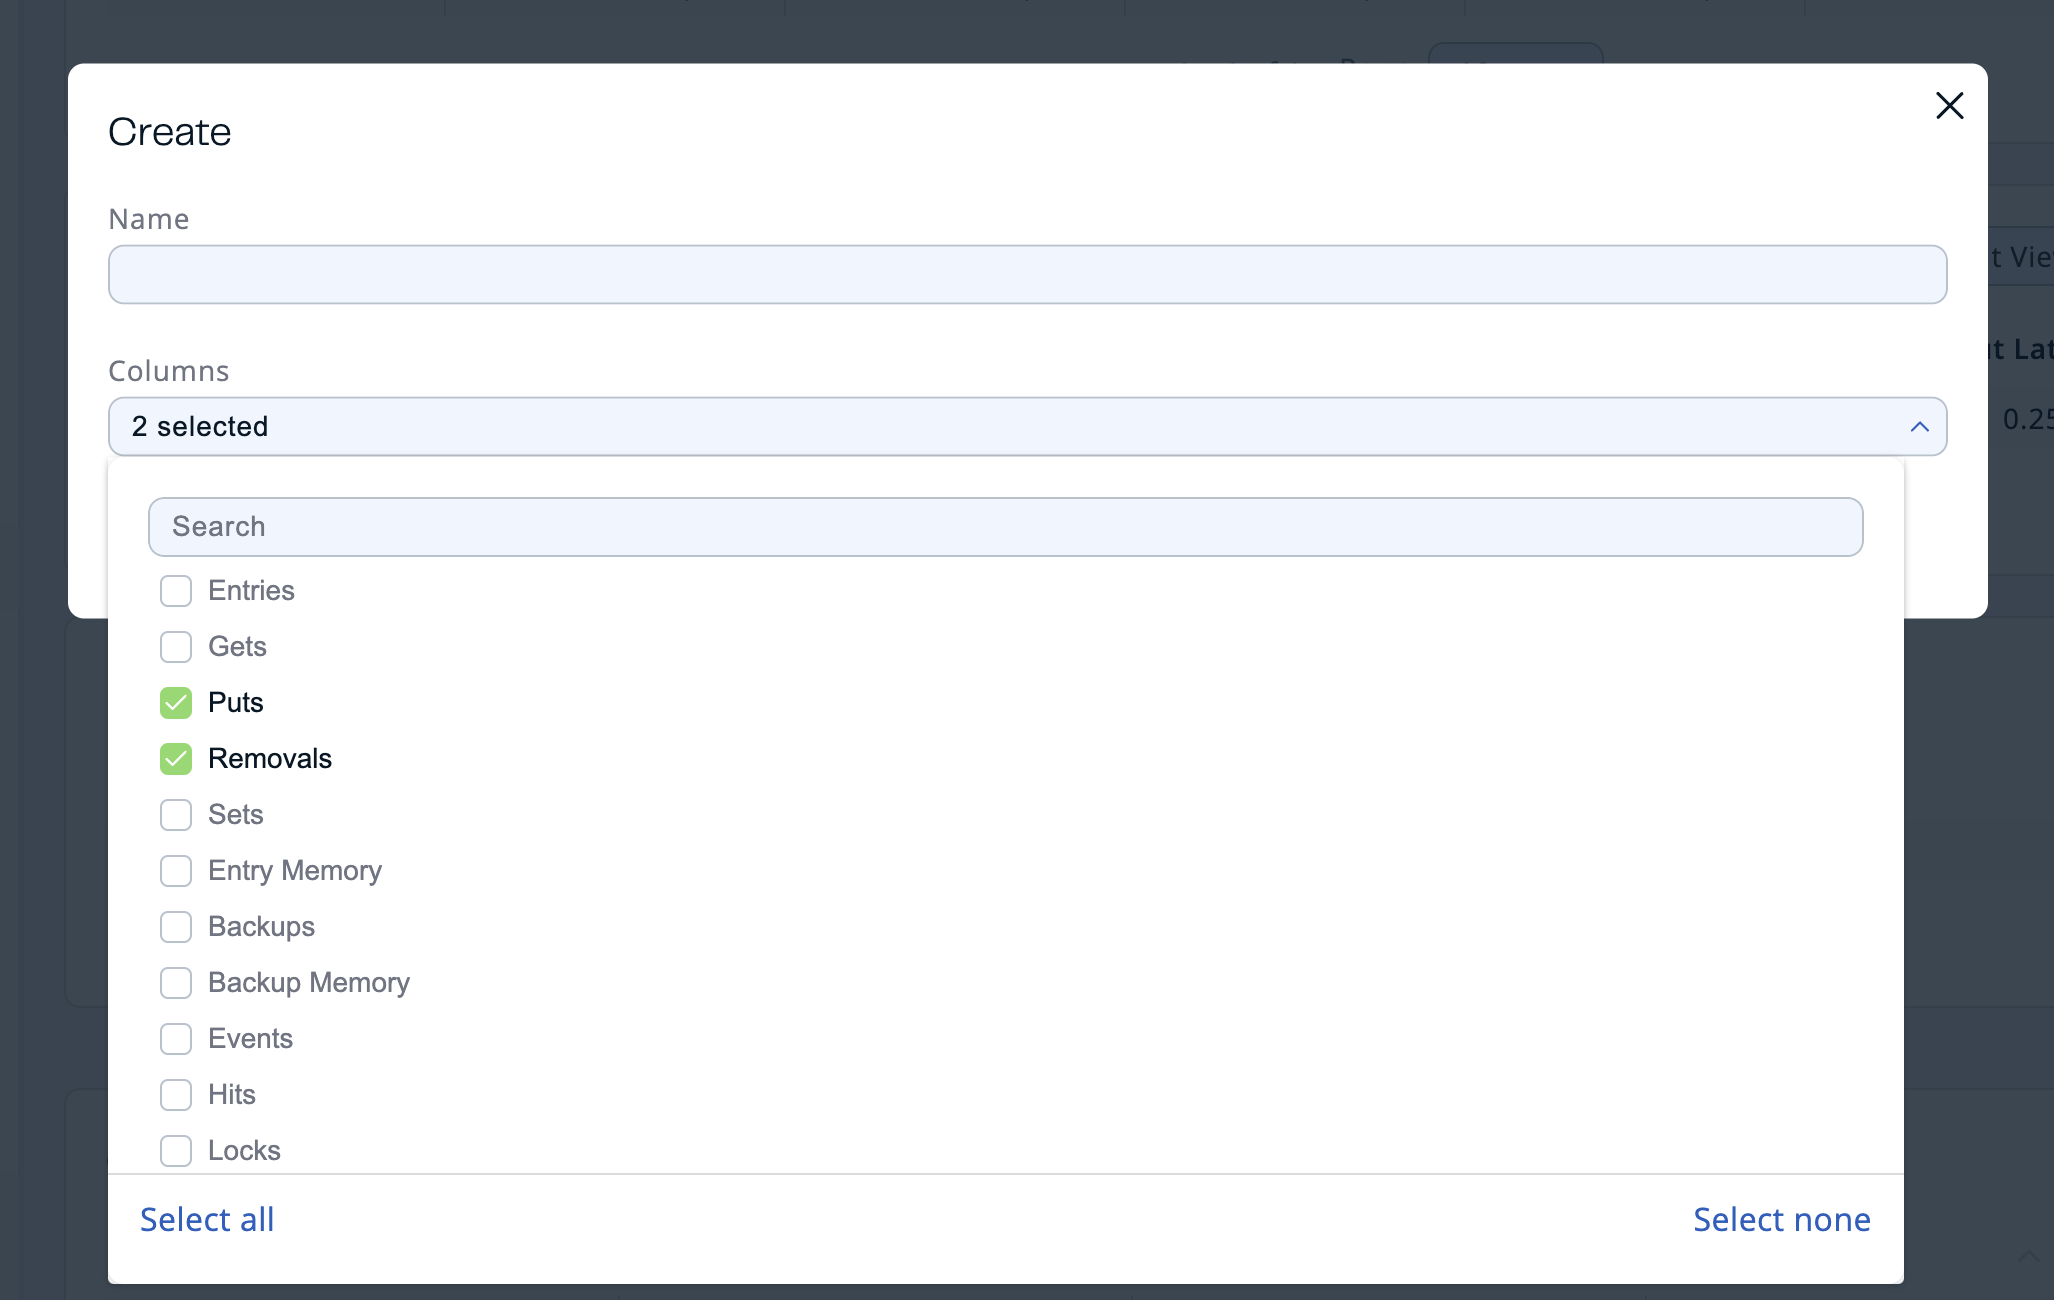
Tables provide access to an extensive list of metrics. These metrics are filtered to match the specific page or data structure. You can customize the displayed columns of a table by defining presets to show only relevant metrics and save these settings with a name of your choice. These custom table configurations are stored within Management Center and become available to all Management Center users and connected clusters. Each table is shipped with at least one system preset, which cannot be edited or removed.
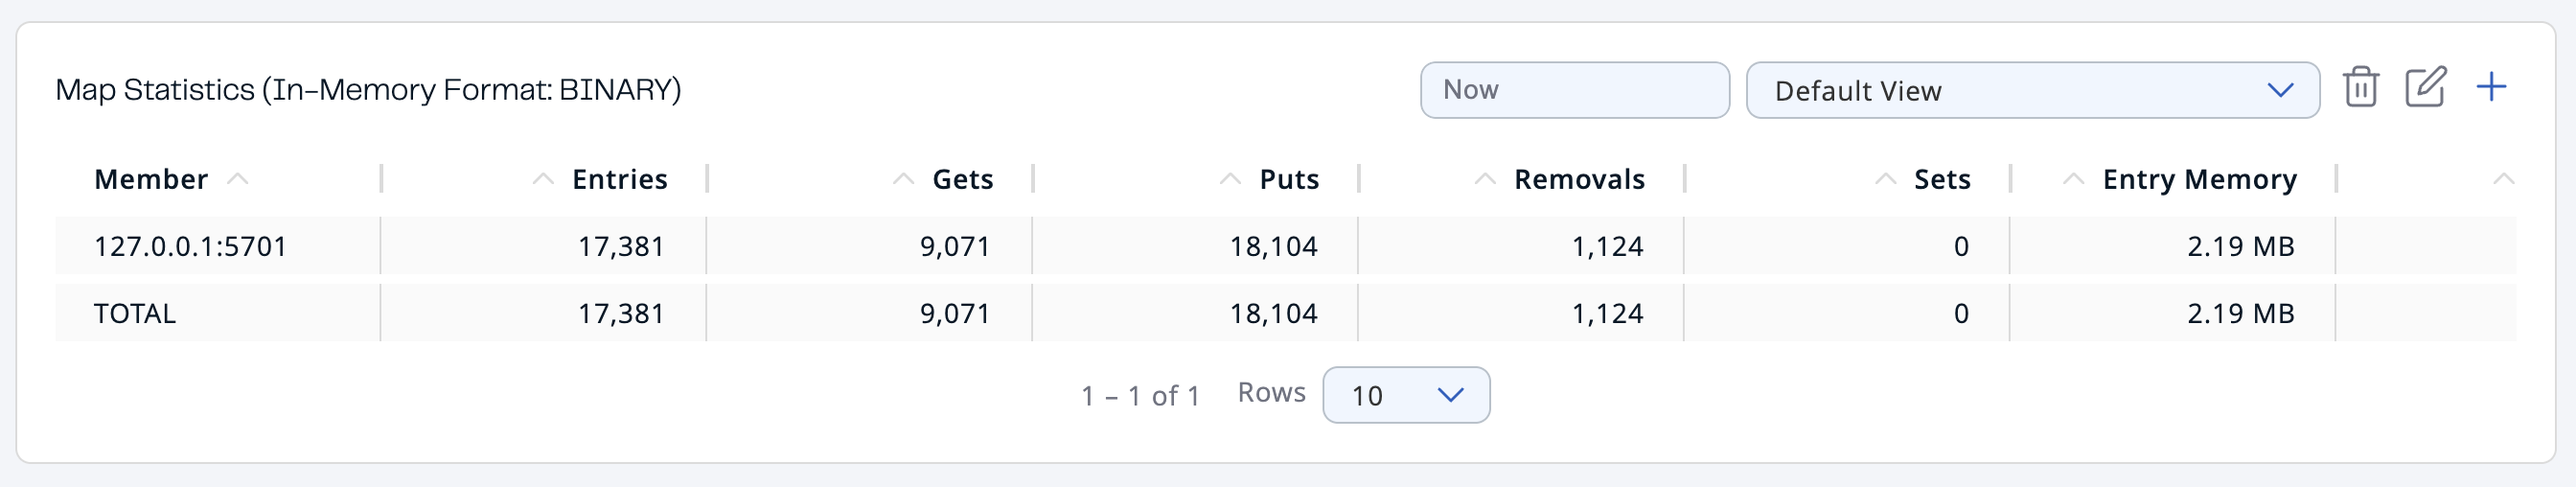
The top-right dropdown shows the name of the current preset and allows you to switch between them. The delete button next to it deletes the selected preset. The pencil and plus buttons open a dialog to edit the selected preset and to define a new preset, respectively. The following is an example which customizes the Map Statistics table to show only the Puts and Removals columns.