You can see a list of all the maps in your cluster by clicking on the Maps menu item on the left panel. A new page is opened on the right, as shown below.
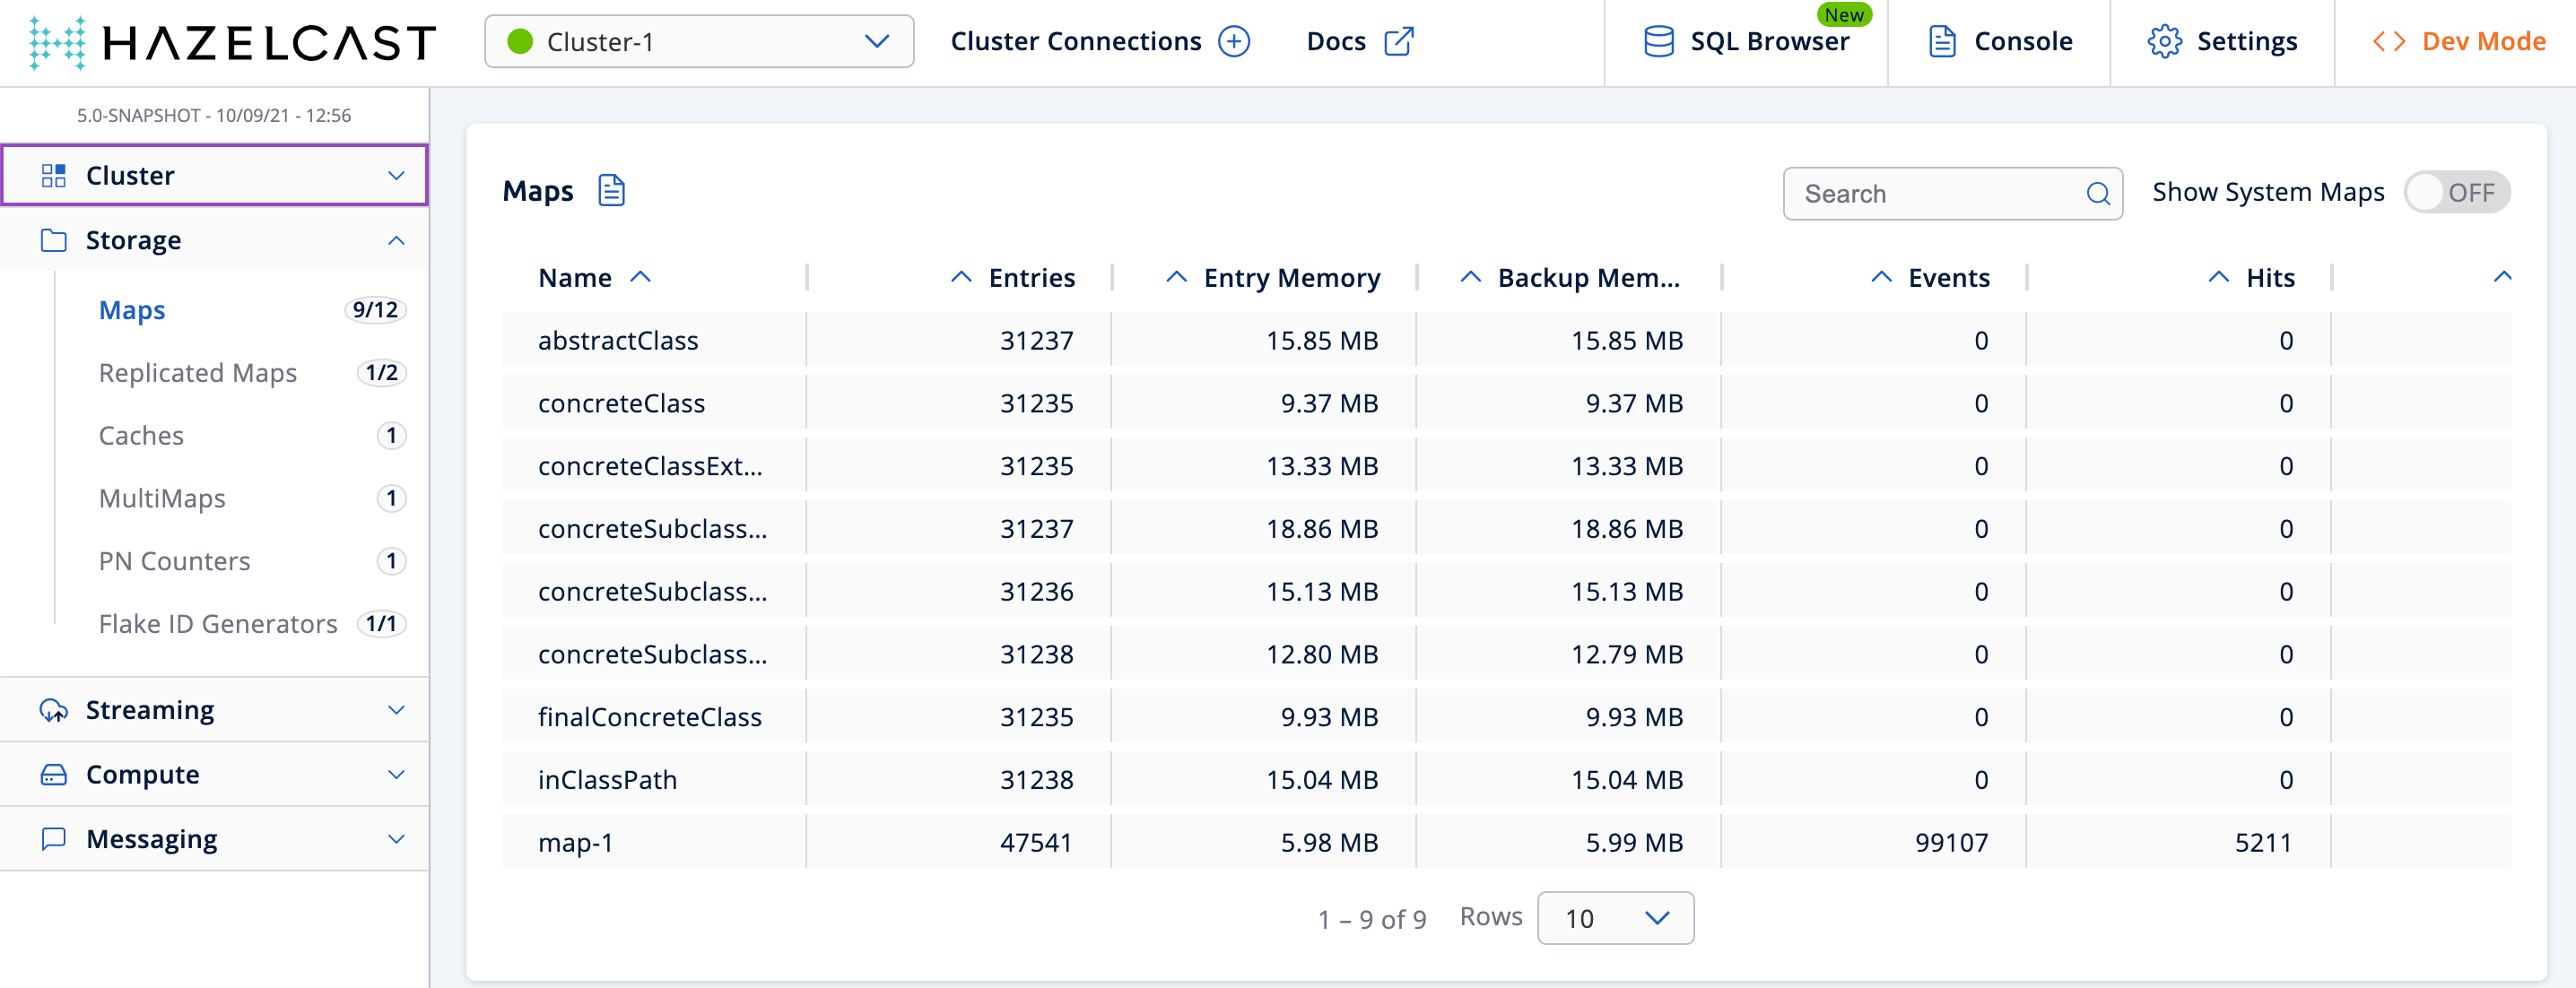
You can filter the maps shown and you can also sort the table by clicking on the column headers. Clicking on a map name opens a new page for monitoring that map instance on the right, as shown below.
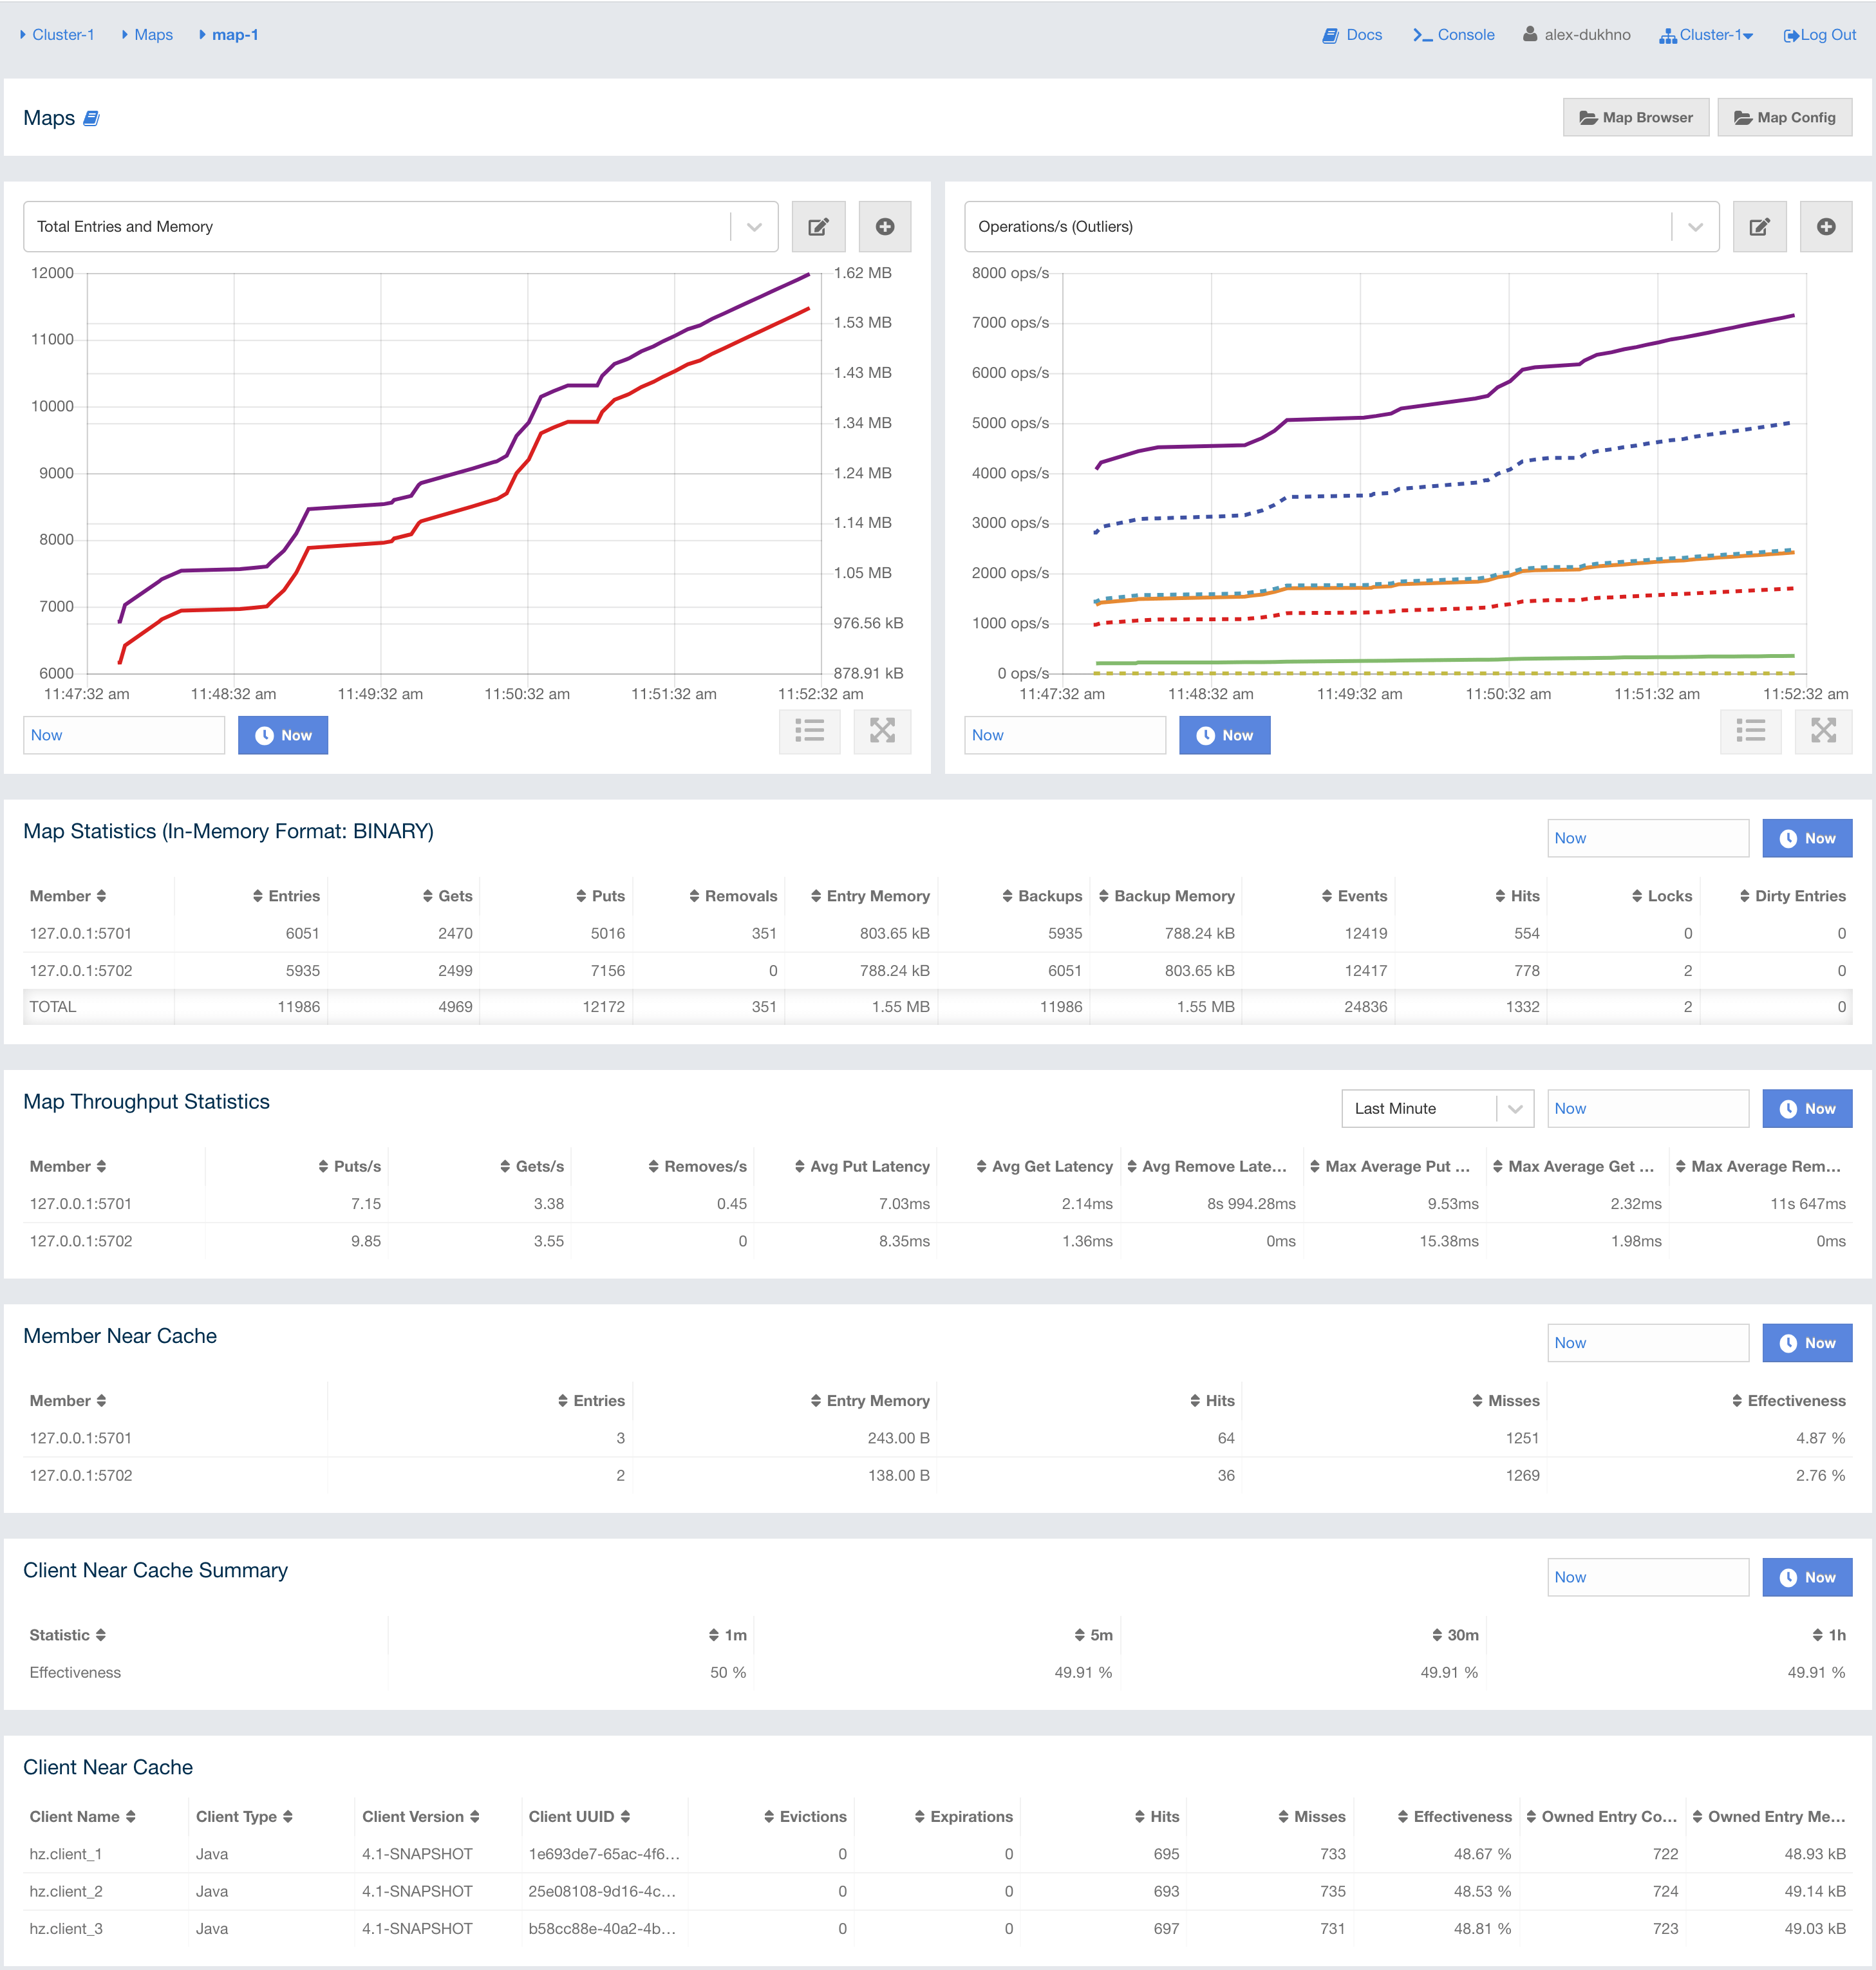
The below subsections explain the portions of this window.
Removing Entries from a Map
You can use the Clear Data button to remove all entries from the map.
In the confirmation modal, enter the map name and confirm that you want to remove all entries from the map.
Exploring Map Entries
You can use the Map Browser tool to retrieve properties of the entries stored in a selected map. To open the Map Browser tool, click on the Map Browser button, located at the top right of the window. Once opened, the tool appears as a dialog, as shown below.
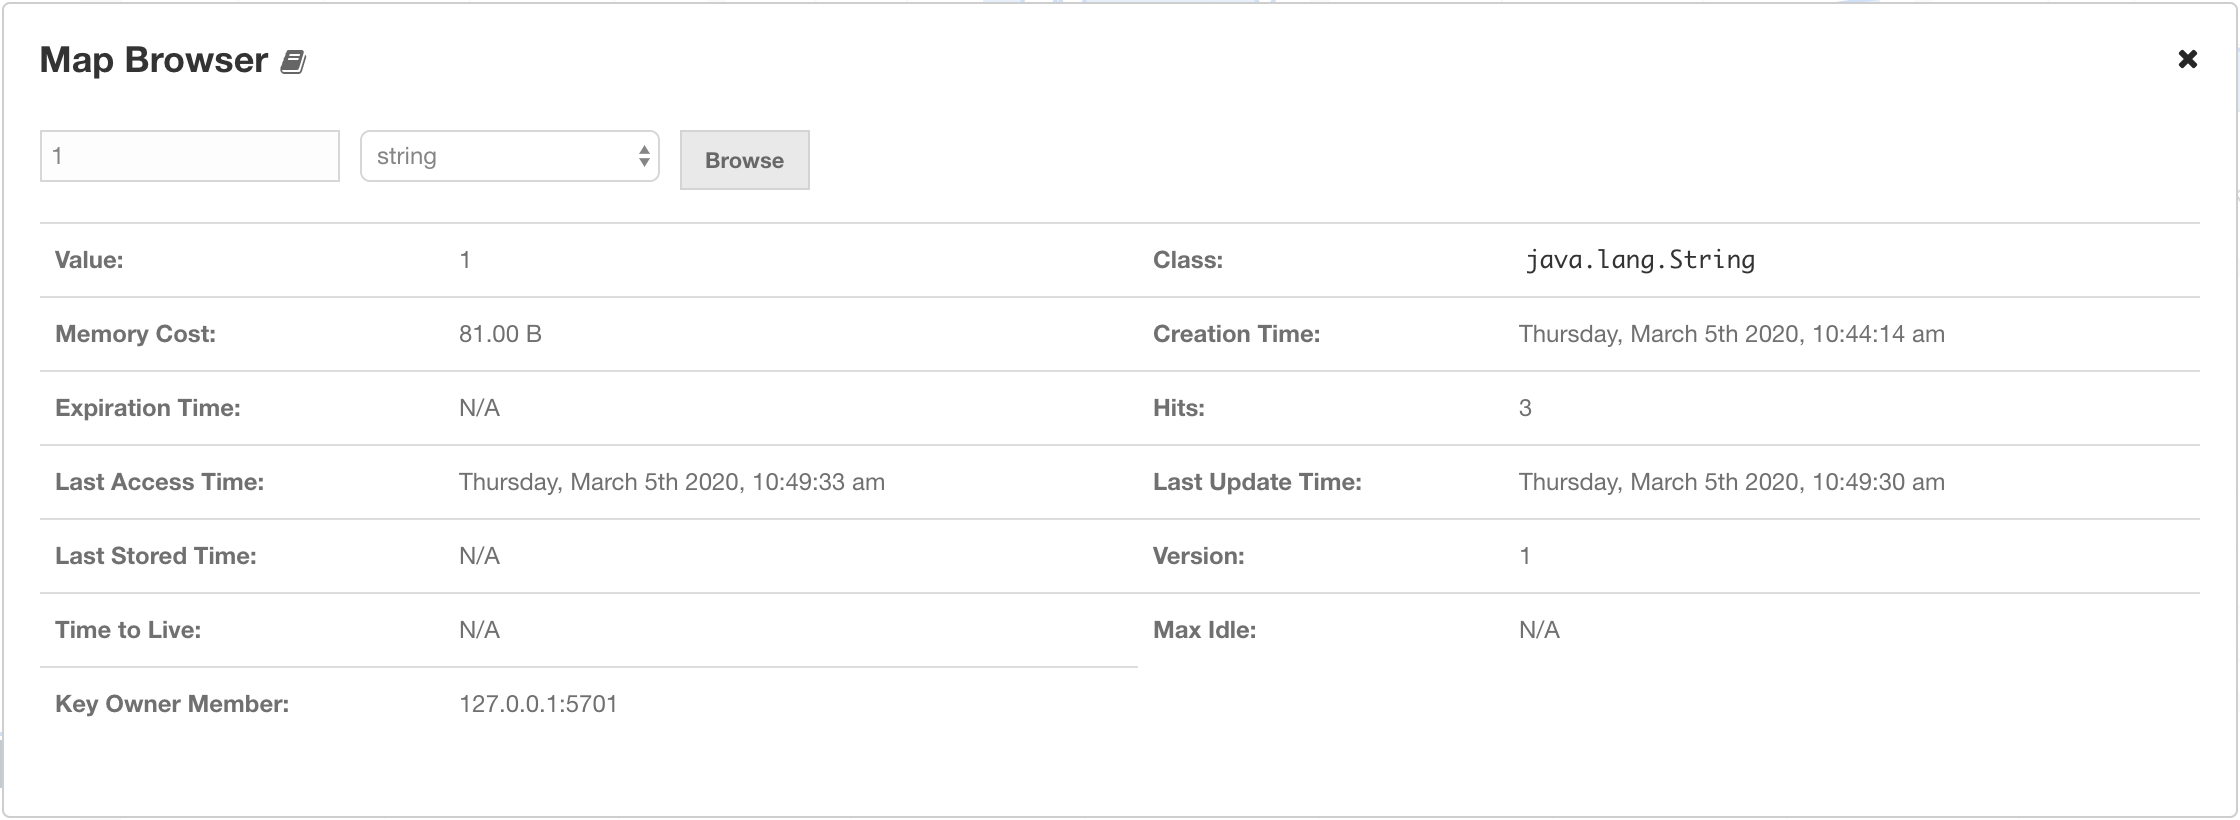
Once the key and the key’s type are specified and the Browse button is clicked, the key’s properties along with its value are listed.
| Field | Description |
|---|---|
Value |
Value that is associated with the key in the map. |
Class |
Key’s Java class. |
Memory Cost |
Space, in bytes, the key and value cost to be hold in memory. |
Creation Time |
First time the key was put. |
Expiration Time |
Time the key was expired and deleted from the map (depends on expiration policy configuration). |
Hits |
Count of reads by the clients for the key’s value in a map. |
Last Access Time |
Last time the clients read the key’s value. |
Last Stored Time |
Last time the key was stored into the storage. |
Version |
Count of times where the key’s value has been overwritten. |
Time to Live |
Last set time to live (in milliseconds). |
Max Idle |
Last set max idle time (in milliseconds). |
If you are using a serialization mechanism other than standard Java
serialization for storing values in your map, you need to
configure the client that Management Center uses for connecting to the
cluster (as described here). Note that if you
have any custom classes, you need to add the JAR containing them
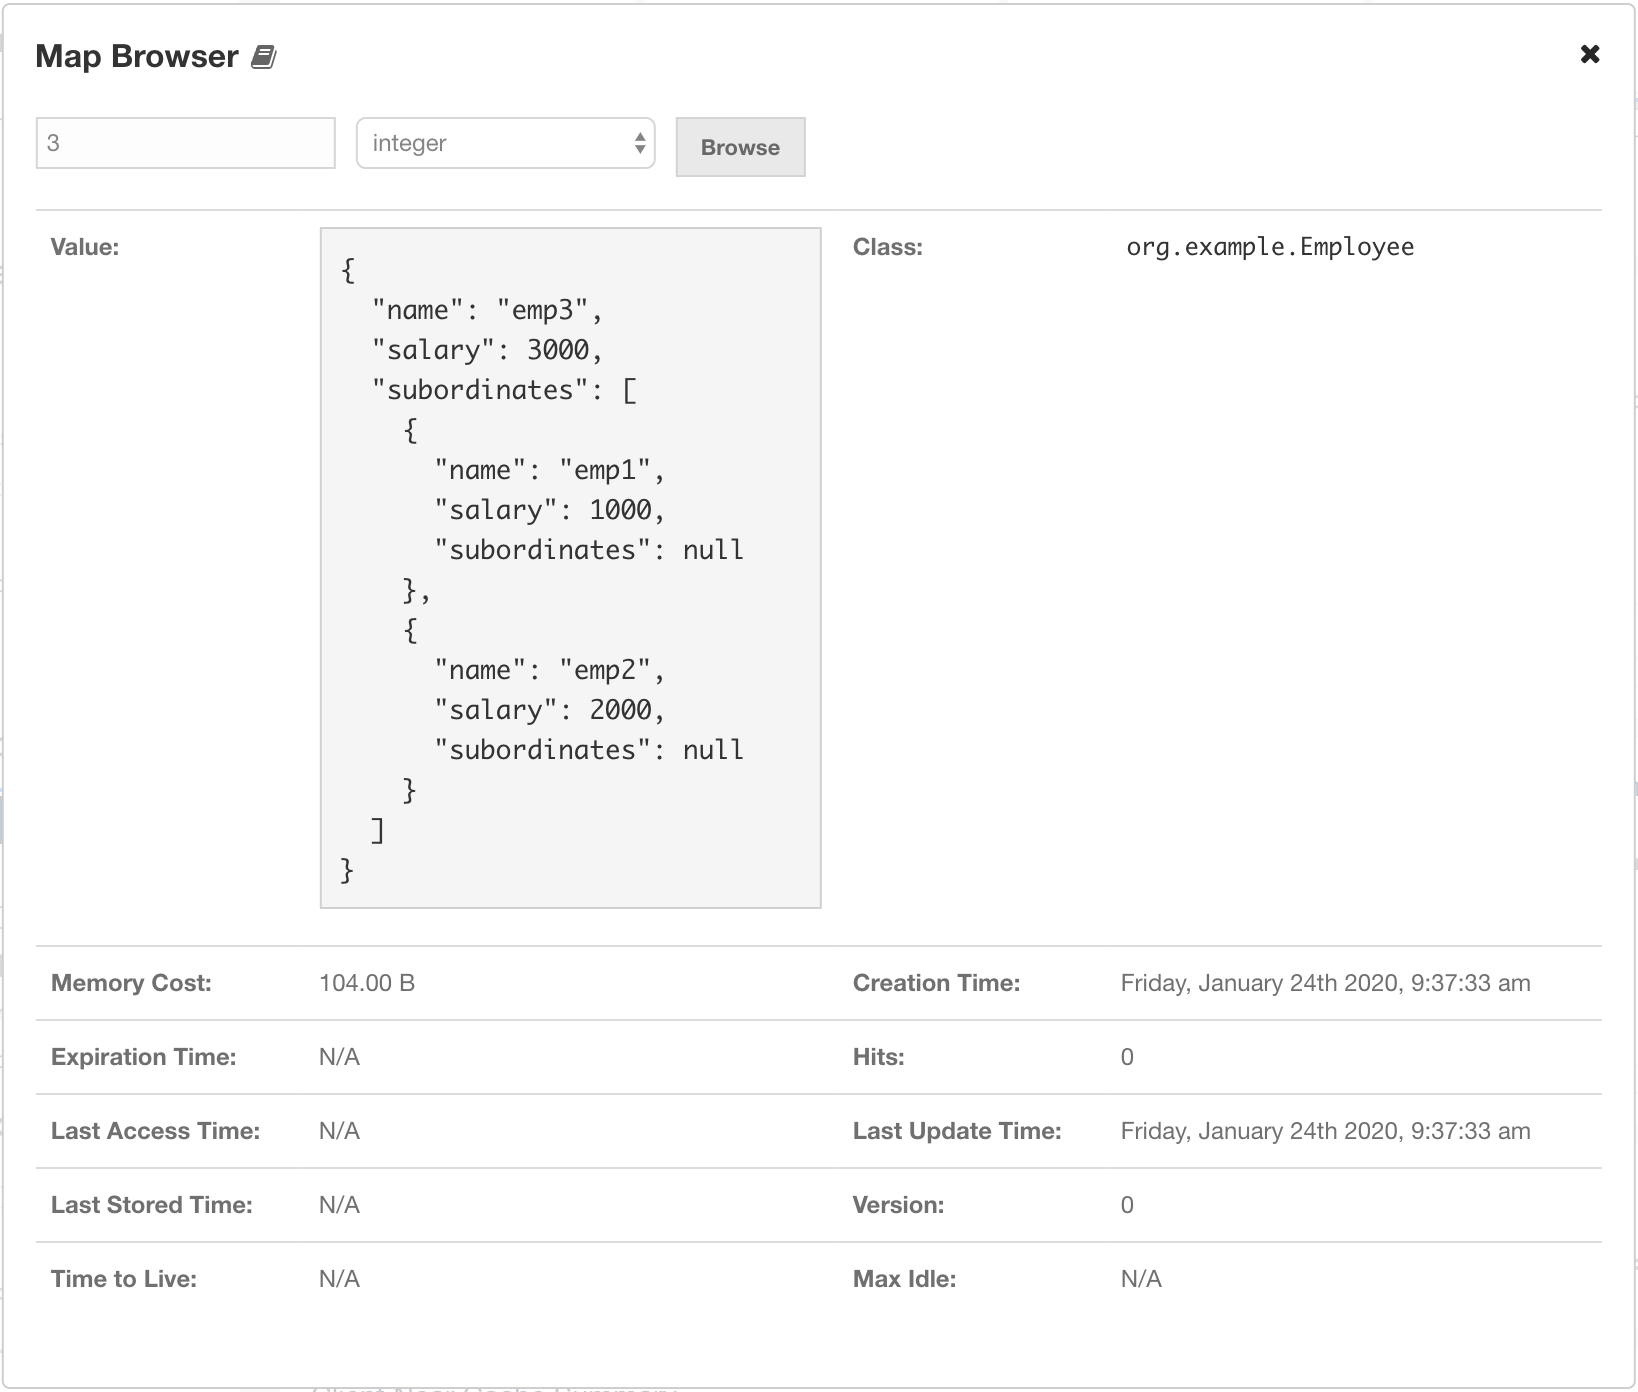
to Management Center’s classpath before starting it as described in Providing an Extra Classpath. In case the value stored in the map is not a String
or of another Java primitive type, it is rendered as a JSON value as shown below:
Configuring a Map
You can use the Map Config tool to set the selected map’s attributes, such as the max size, TTL, and eviction policy. To open the Map Config tool, click on the Map Config button, located at the top right of the window. Once opened, the tool appears as a dialog, as shown below.
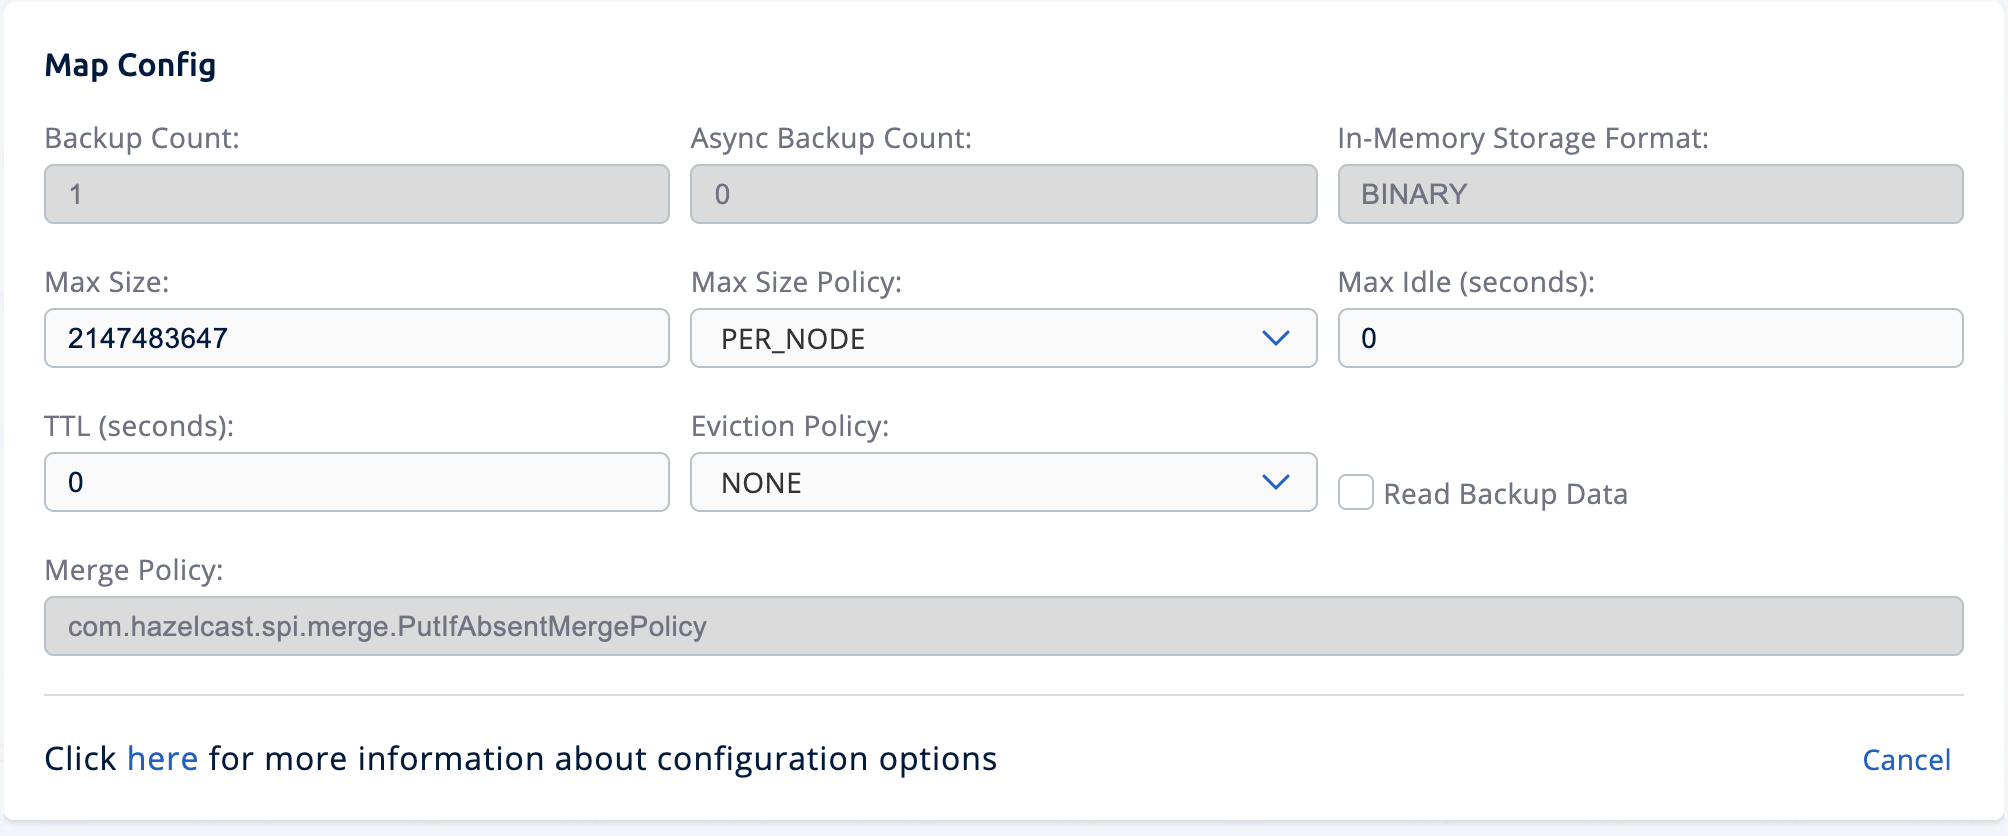
You can change any attribute and click the Update button to save your changes.
Monitoring a Map
Besides the Map Browser and Map Config tools, the map monitoring page shows two graphs that show various metrics of the map. See the graph section for more information.
Under these charts are Map Statistics, Map Throughput, Member Near Cache, and Client Near Cache data tables.
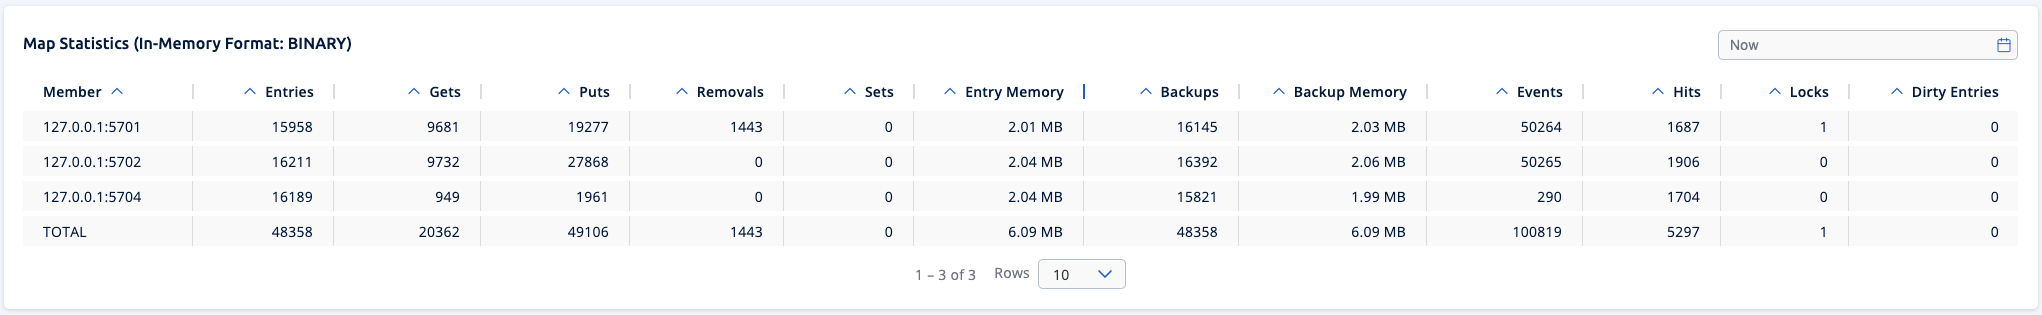
From left to right, this table lists the following:
| Field | Description |
|---|---|
Members |
IP address and port of the member. |
Entries |
Number of entries owned by the member. |
Gets |
Number of get operations received by the member. |
Puts |
Number of put operations received by the member. |
Removes |
Number of remove operations received by the member. |
Entry Memory |
Memory cost of owned entries in the member. |
Backups |
Number of backup entries held by the member. |
Backup Memory |
Memory cost of backup entries held by the member. |
Events |
Number of map events received by the member. A map event is triggered when a map entry is added, removed, updated, evicted, expired, merged, loaded, invalidated, or included in the "evict all" or "clear all" operations. |
Hits |
Number of hits (reads) of the entries that are owned by the member, including those which are no longer in the map (for example, may have been evicted). The number of hits may be inaccurate after a partition is migrated to a new owner member. |
Locks |
Number of currently locked entries owned by the member. |
Dirty Entries |
Number of entries that the member owns and are dirty (updated but not persisted yet). In the cases where MapStore is enabled, these are the entries that are put to/removed from the map but not written to/removed from a database yet. |
You can ascend or descend the order of the listings by clicking on the column headings.
Map Throughput Table provides information about the operations (get, put, remove) performed on each member in the map, as shown below.
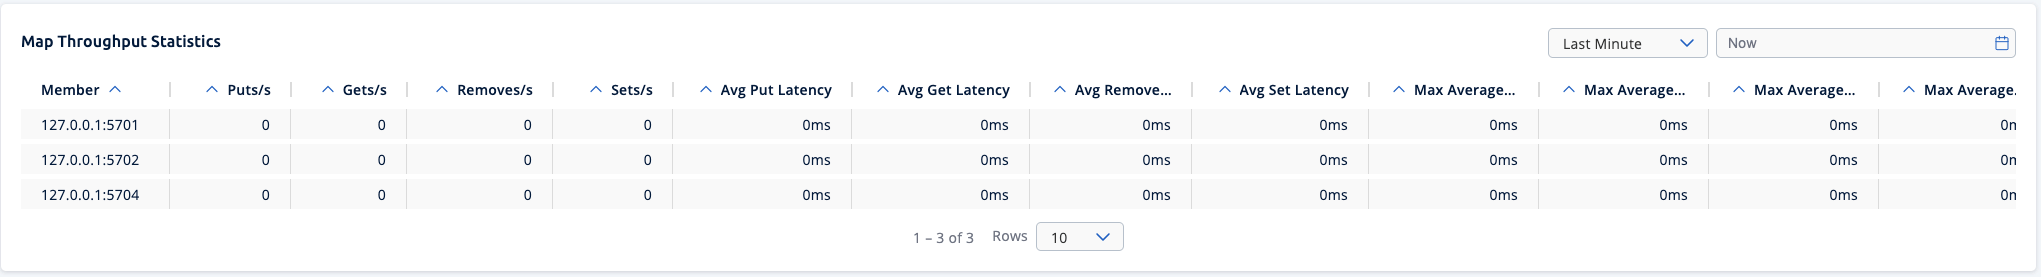
From left to right, this table lists the following:
| Field | Description |
|---|---|
Members |
IP address and port of the member. |
Puts/s |
Number of put operations per second on the member. |
Gets/s |
Number of get operations per second on the member. |
Removes/s |
Number of remove operations per second on the member. |
Avg Put Latency |
Average latency of put operations on the member. |
Avg Get Latency |
Average latency of get operations on the member. |
Avg Remove Latency |
Average latency of remove operations on the member. |
Max Avg Put Latency |
Maximum average latency of put operations on the member. |
Max Avg Get Latency |
Maximum average latency of get operations on the member. |
Max Avg Remove Latency |
Maximum average latency of remove operations on the member. |
You can select the time period in the combo box placed on the top right corner of the window, for which the table data will be shown. Available values are Since Beginning, Last Minute, Last 10 Minutes and Last 1 Hour.
To ascend or descend the order of the listings, click on the column headings.
Member Near Cache Table provides information about the Member Near Caches, if available, on each member, as shown below.
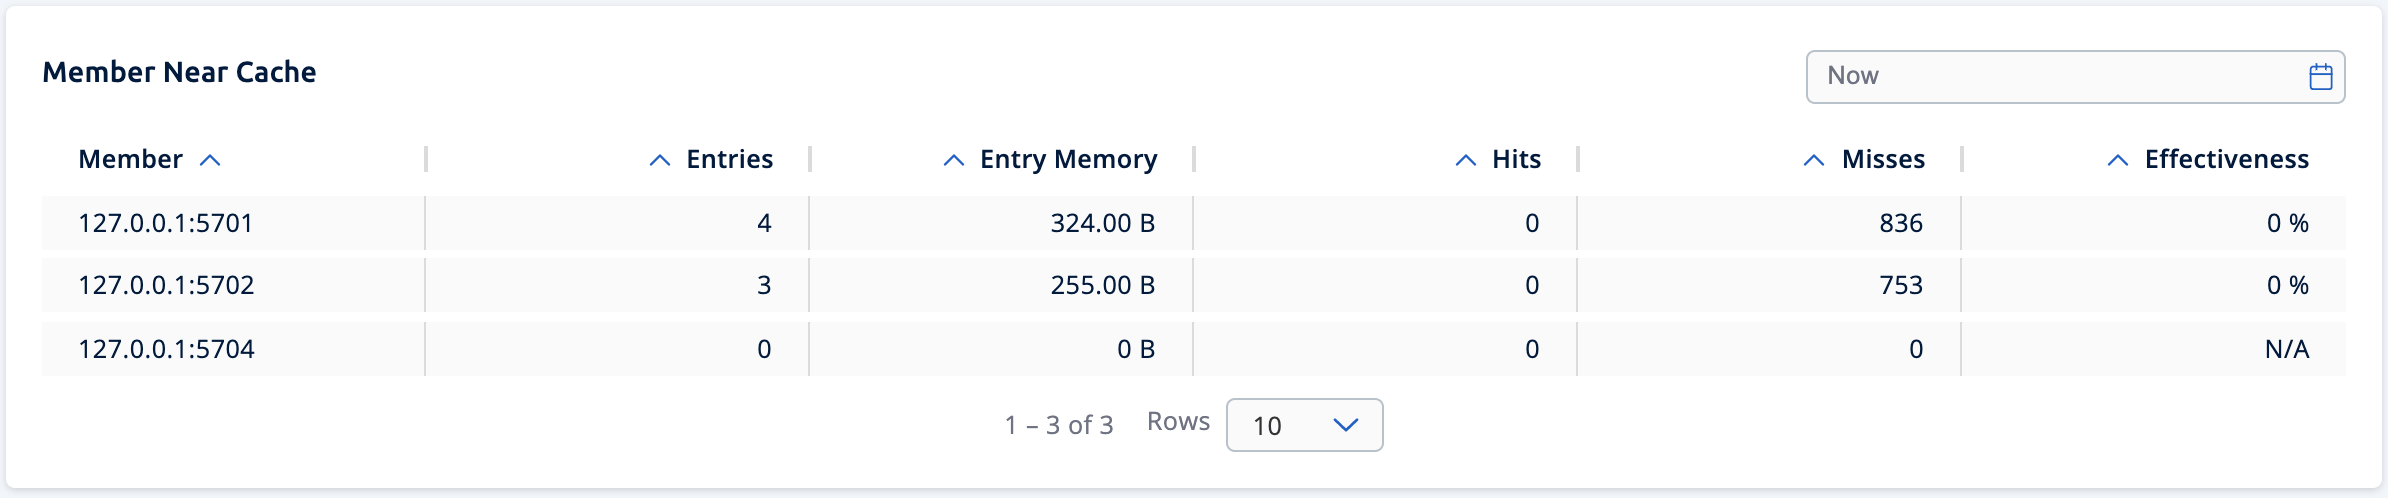
From left to right, this table lists the following:
| Field | Description |
|---|---|
Members |
IP address and port of the member which has Near Caches defined for the maps. |
Entries |
Count of the entries in each Near Cache. |
Entry Memory |
Memory cost of the entries in each Near Cache. |
Hits |
Count of the entries read from the Near Cache. |
Misses |
Count of the entries which cannot be found in the Near Cache when requested to read. |
Ratio |
Hits/Misses ratio. |
To ascend or descend the order of the listings, click on the column headings.
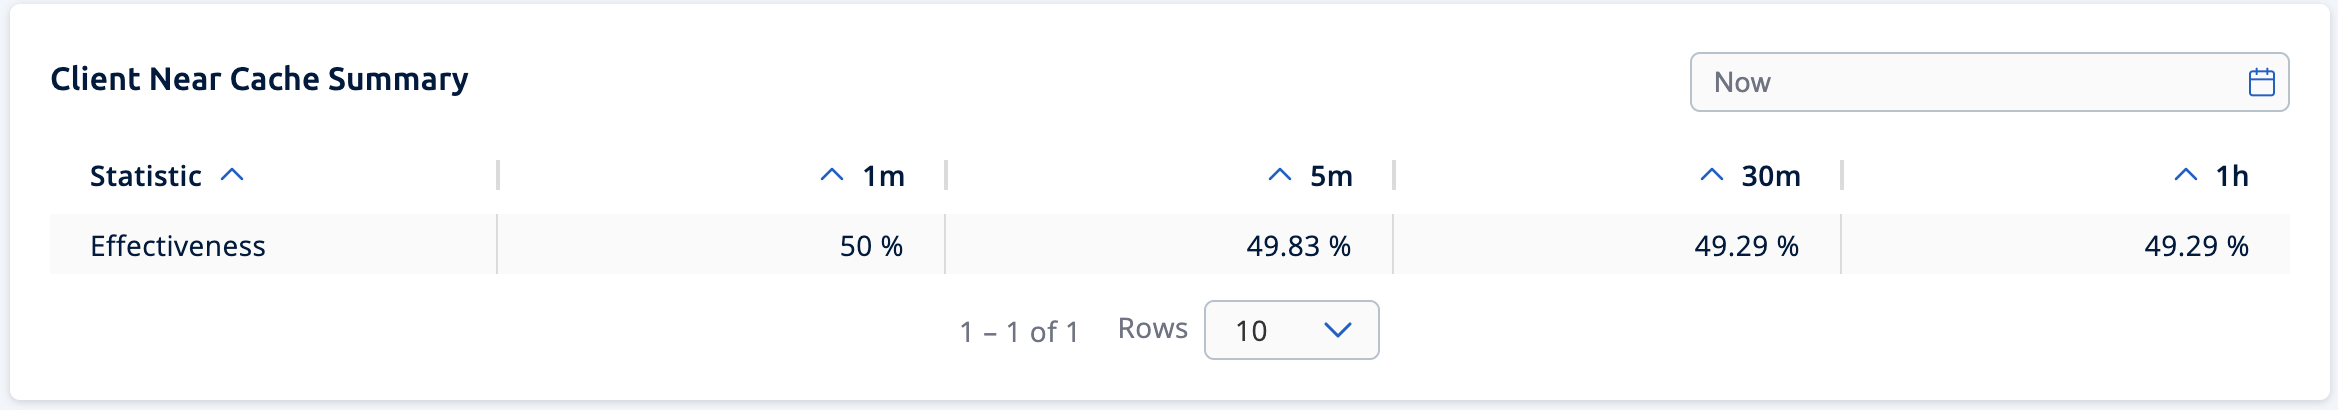
Client Near Cache Summary provides summary information related to the Near Cache statistics aggregated for all the clients that have Near Cache enabled for this map. Aggregated statistics are shown for the following periods: 1 minute, 5 minutes, 30 minutes and 60 minutes. Currently, the table shows overall Near Cache effectiveness, calculated as hits/total reads ratio.
| You need to enable the statistics for clients to see them here. See the Monitoring Clients section for details. |
Client Near Cache Table provides information about the Near Caches statistics, if available, on each client that has Near Cache enabled for this map, as shown below.
| You need to enable the statistics for clients to see them here. See the Monitoring Clients section for details. |
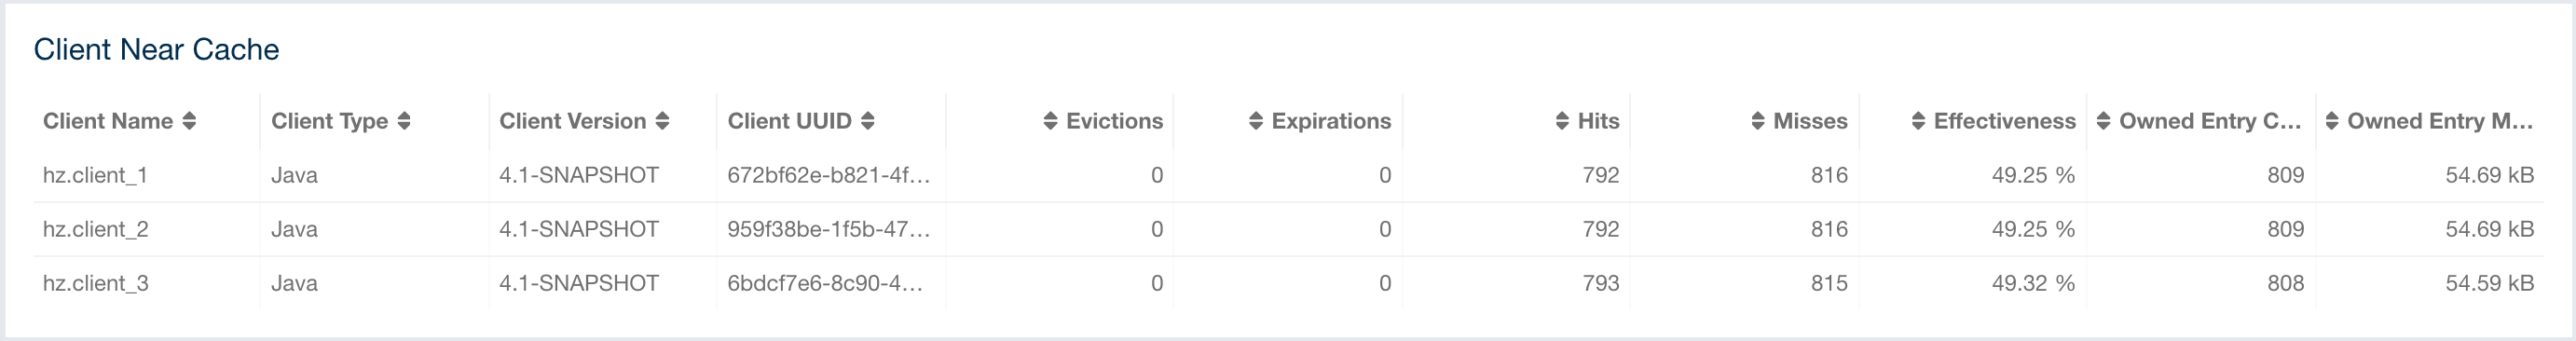
From left to right, this table lists the following:
| Field | Description |
|---|---|
Client Name |
Name of the client instance which has Near Cache defined for the map. |
Client Type |
Type of the client. |
Client Version |
Version of the client. |
Client UUID |
Client unique identifier. |
Evictions |
Number of evictions of Near Cache entries owned by the client. |
Expirations |
Number of TTL and max-idle expirations of Near Cache entries owned by the client. |
Hits |
Number of hits (reads) of Near Cache entries owned by the client. |
Misses |
Number of misses of Near Cache entries owned by the client. |
Effectiveness |
Hits/total reads ratio. |
Owned Entry Count |
Number of Near Cache entries owned by the client. |
Owned Entry Memory Cost |
Memory cost of Near Cache entries owned by the client. |
To ascend or descend the order of the listings, click on the column headings.