You can see a list of all the Executors in your cluster by clicking on the Executors menu item on the left panel. A new page is opened on the right, as shown below.

You can filter the Executors shown and you can also sort the table by clicking on the column headers. Clicking on an Executor name opens a new page for monitoring that Executor instance on the right, as shown below.
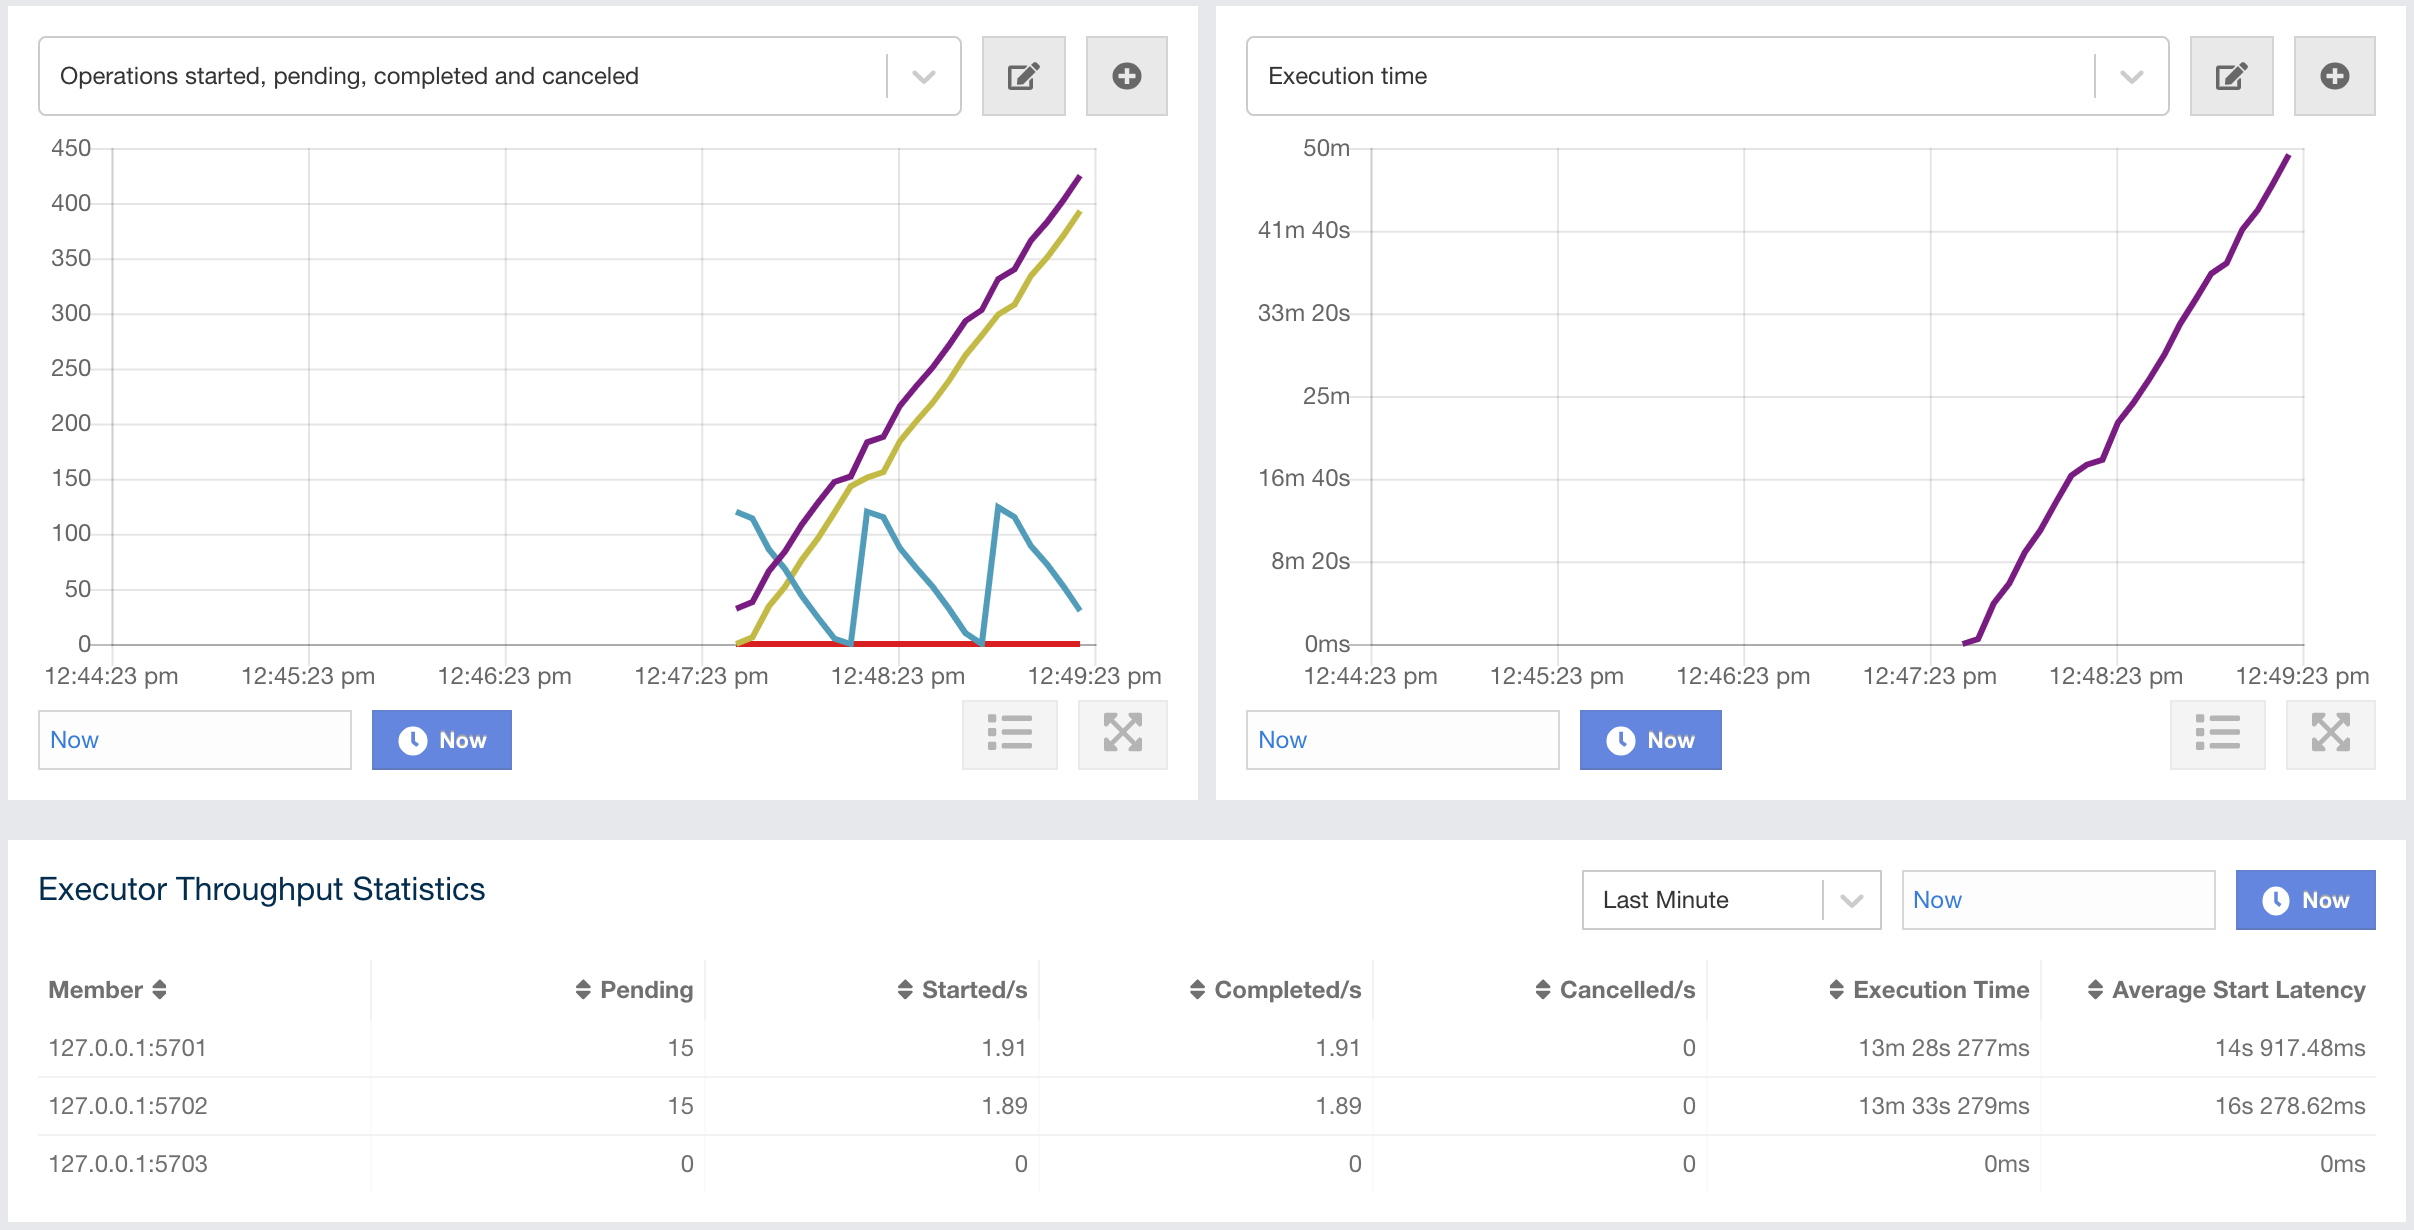
On top of the page, there are two graphs that show various metrics of the Executor. See the the graph section for more information.
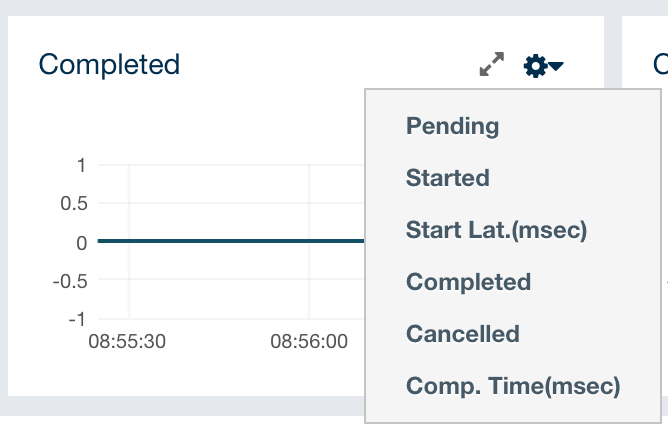
When you click on a desired monitoring, the chart loads with the
selected option. To open a chart as a separate dialog, click on the
 button placed at top right of each
chart. The below monitoring charts are available:
button placed at top right of each
chart. The below monitoring charts are available:
-
Pending: Monitors the pending executors. Y-axis is the executor count.
-
Started: Monitors the started executors. Y-axis is the executor count.
-
Start Lat. (msec.): Shows the latency when executors are started. Y-axis is the duration in milliseconds.
-
Completed: Monitors the completed executors. Y-axis is the executor count.
-
Comp. Time (msec.): Shows the completion period of executors. Y-axis is the duration in milliseconds.
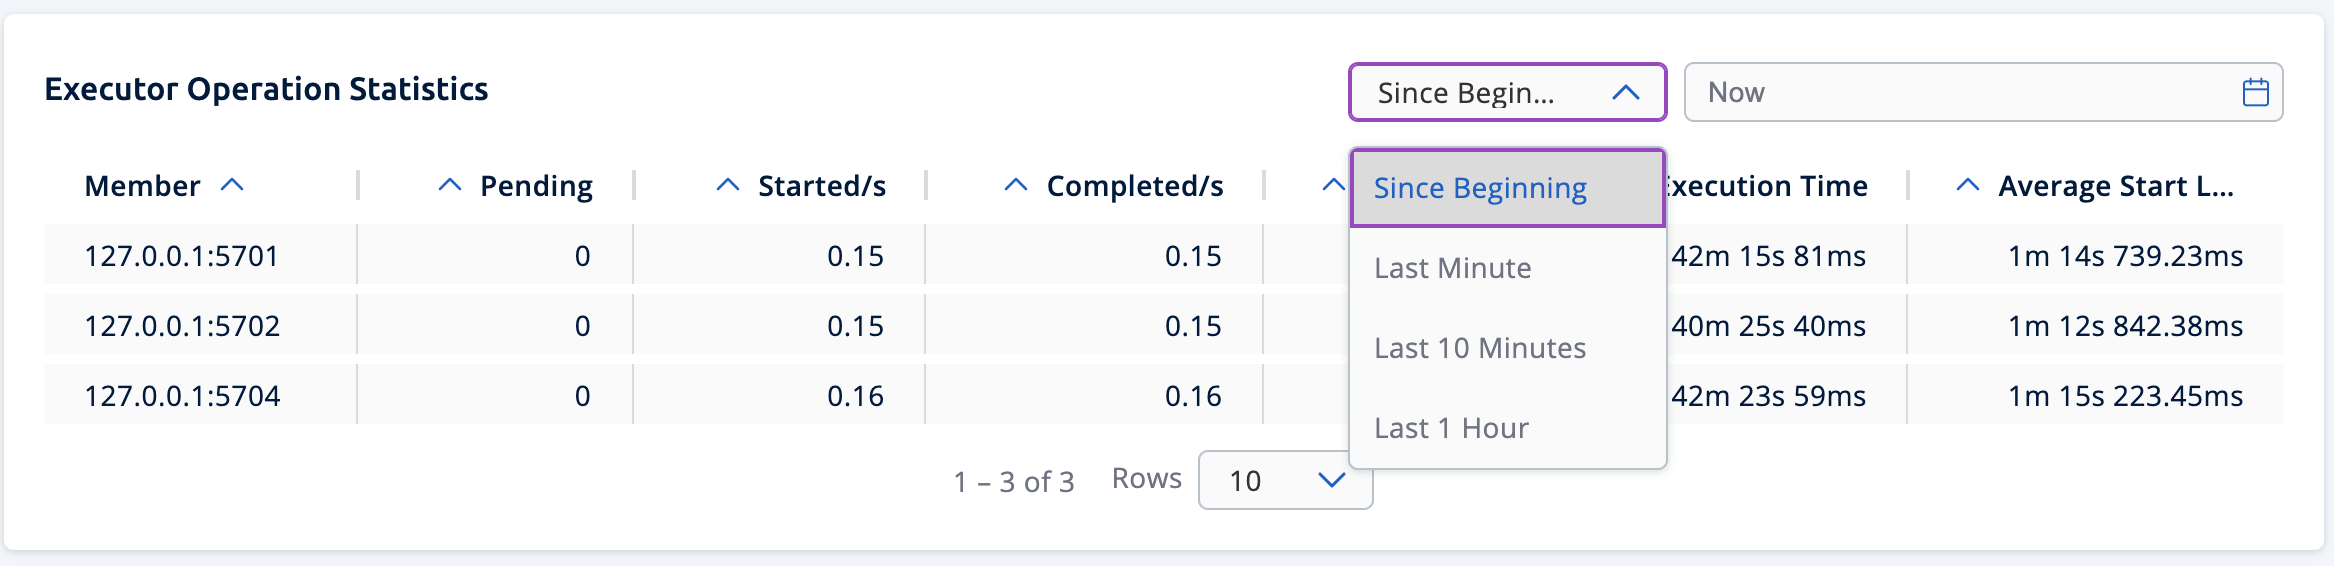
From left to right, this table lists the IP address and port of members, the counts of pending, started and completed executors per second, and the execution time and average start latency of executors on each member. Click on the column heading to ascend or descend the order of the listings.