You can see a list of all the caches in your cluster by clicking on the Caches menu item on the left panel. A new page is opened on the right, as shown below.
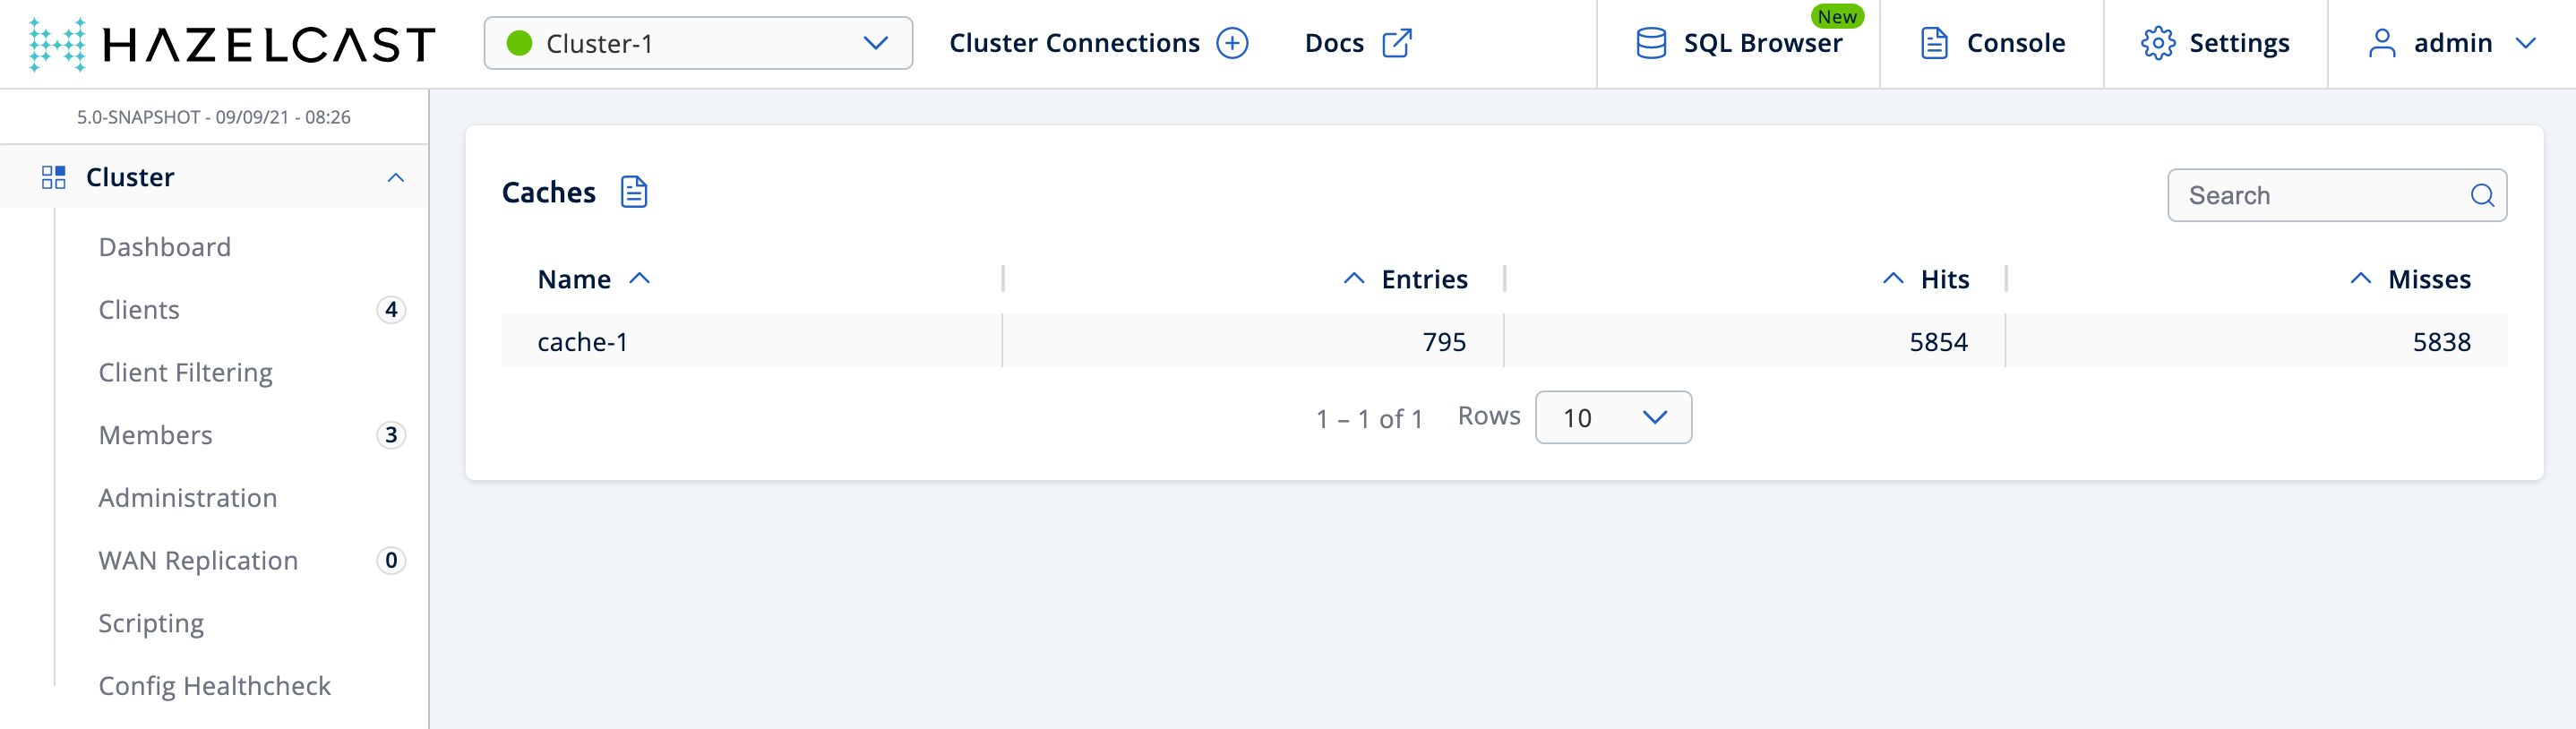
You can filter the caches shown and you can also sort the table by clicking on the column headers. Clicking on the cache name opens a new page for monitoring that cache instance on the right, as shown below.
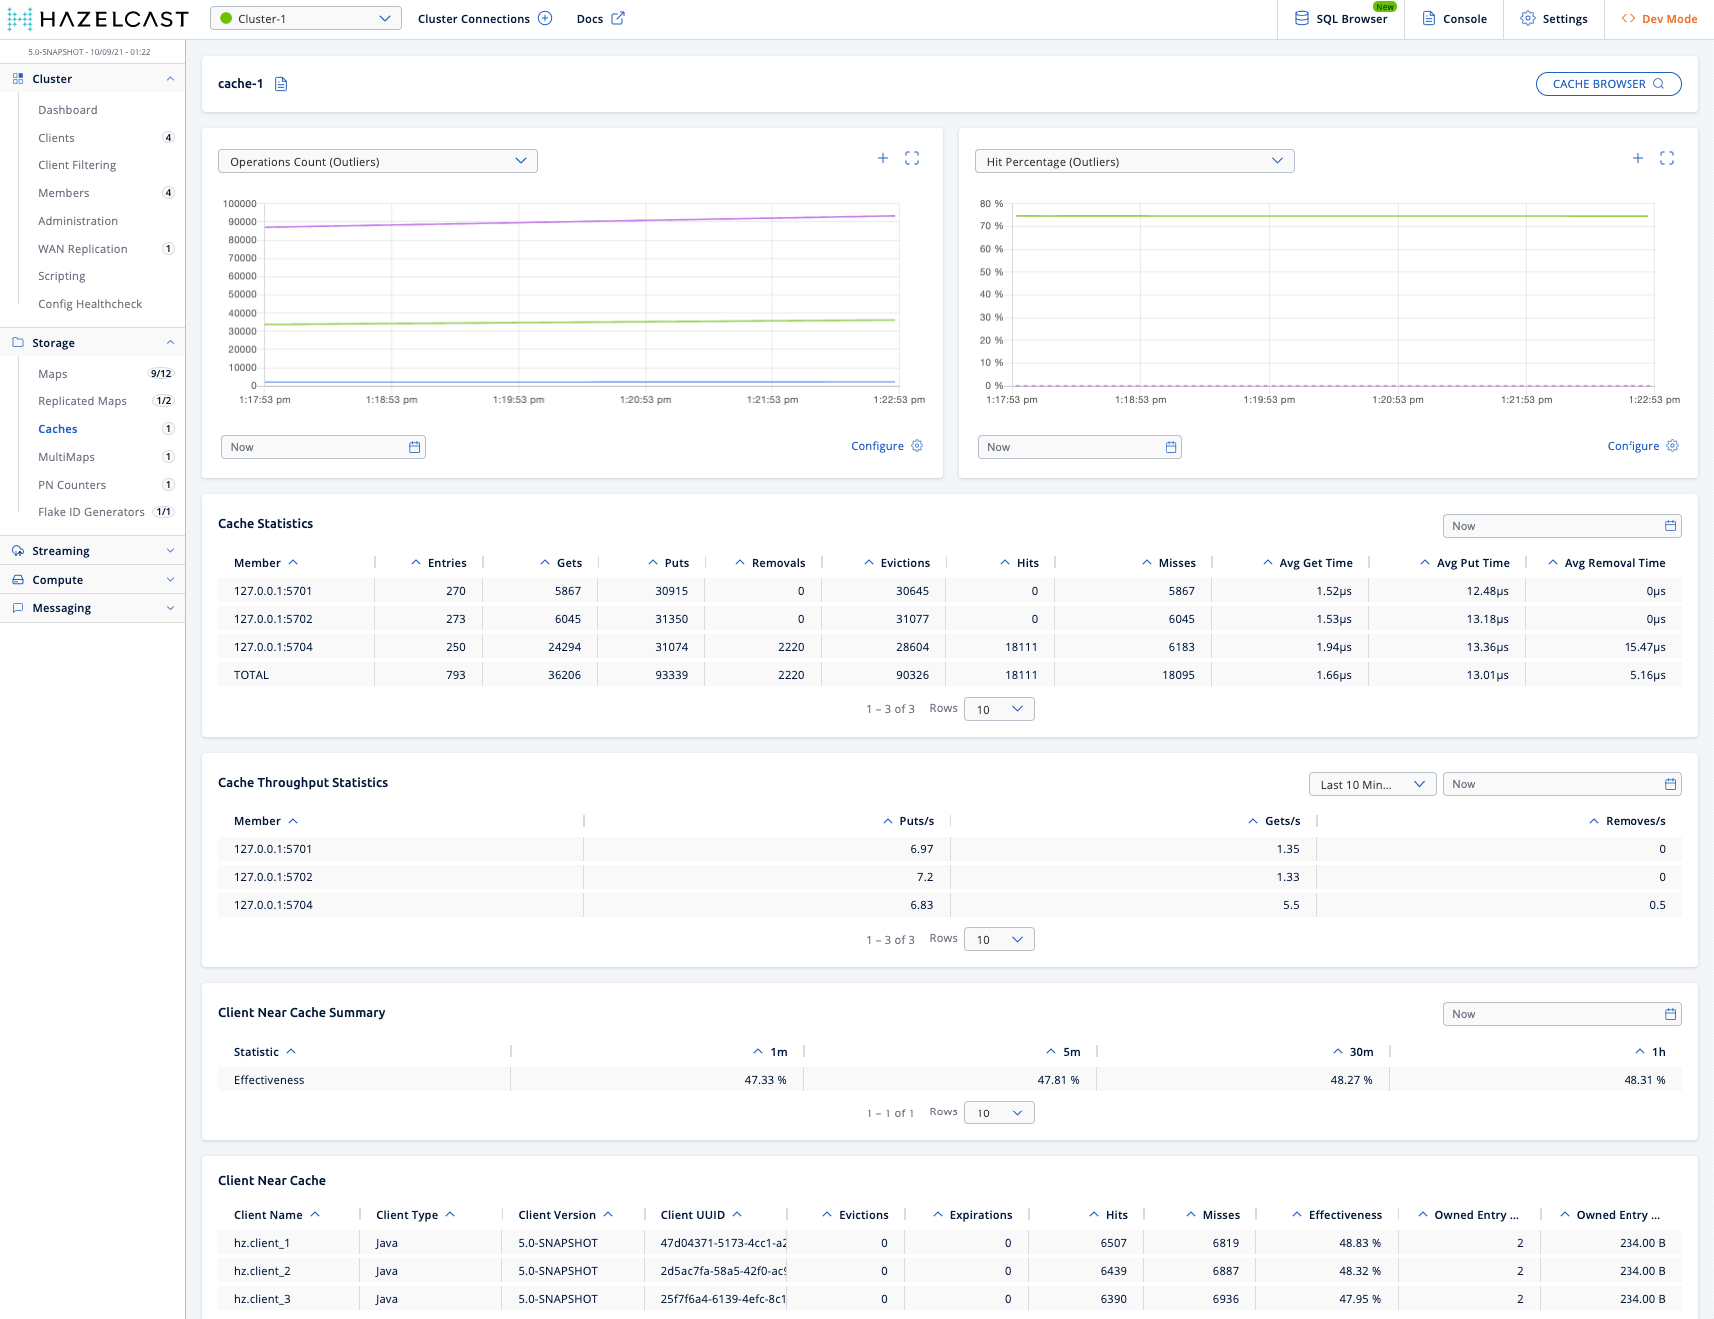
On top of the page, there are two graphs that show various metrics of the cache. See the graph section for more information.
Under these charts are Cache Statistics, Cache Throughput, and Client Near Cache data tables.
Cache Statistics Table provides the selected cache’s statistics distributed over the members, as shown below.
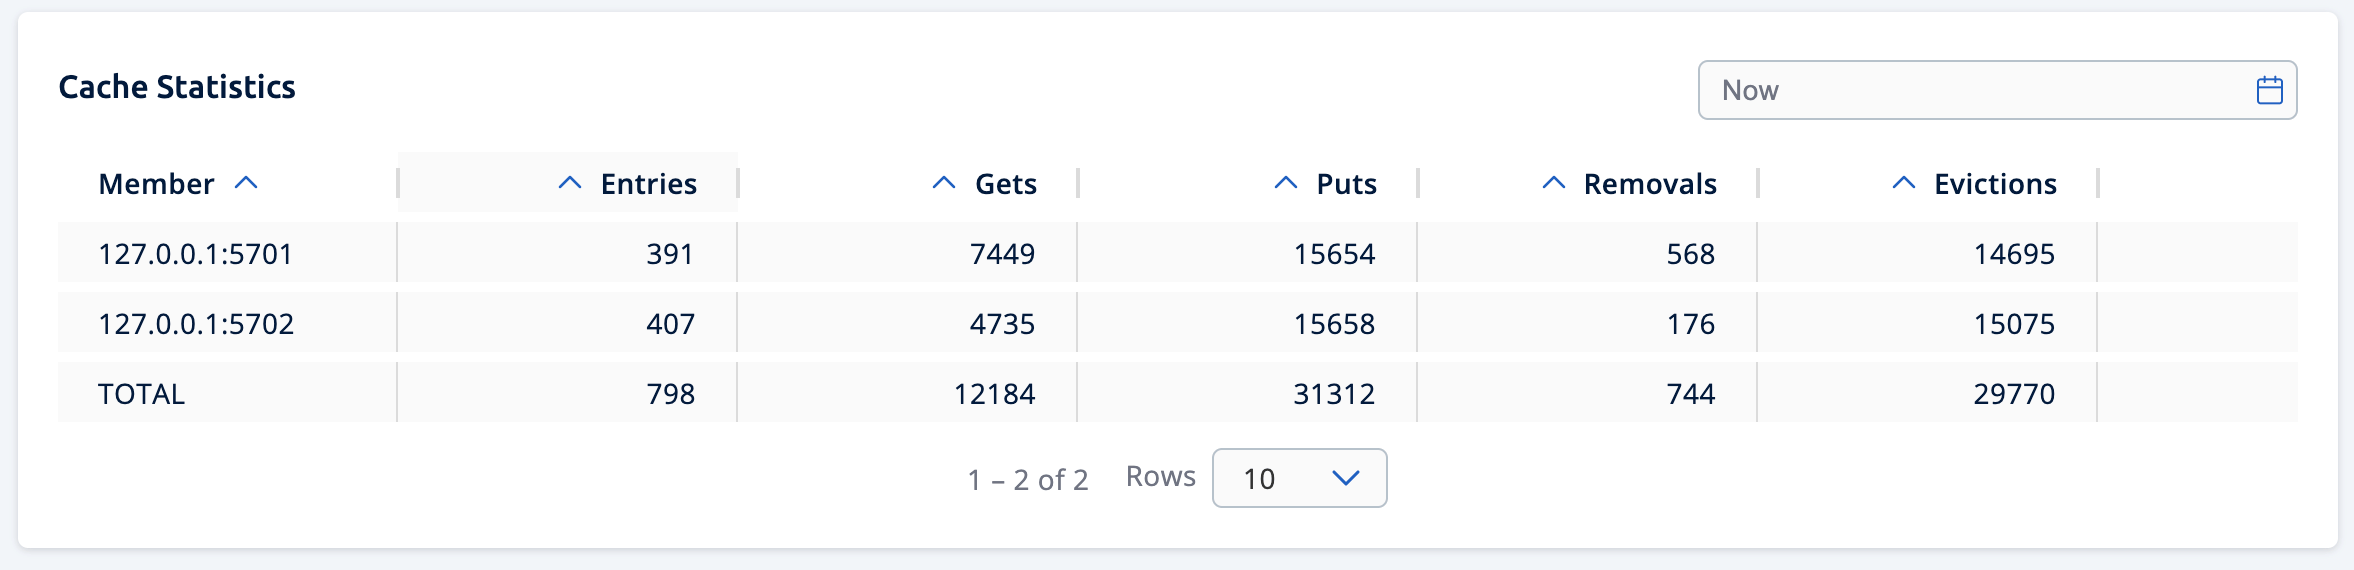
From left to right, this table lists the following in real time:
| Field | Description |
|---|---|
Members |
IP address and port of the member. |
Entries |
Number of entries in this cache owned by the member. |
Gets/Puts/Removals |
Number of the get/put/remove operations for this cache received by the member. |
Evictions |
Number of evictions of Cache entries owned by the member. |
Hits |
Number of the reads performed for this cache’s entries. |
Misses |
Number of the entries which cannot be found in the cache when requested to read. |
Avg Get/Put/Removal Time |
Average elapsed time for the get/put/removal operations for the cache on each member. |
To ascend or descend the order of the listings, click on the column headings.
Cache Throughput Statistic Table provides information about the operations (get, put, remove) performed on each member for the selected cache.
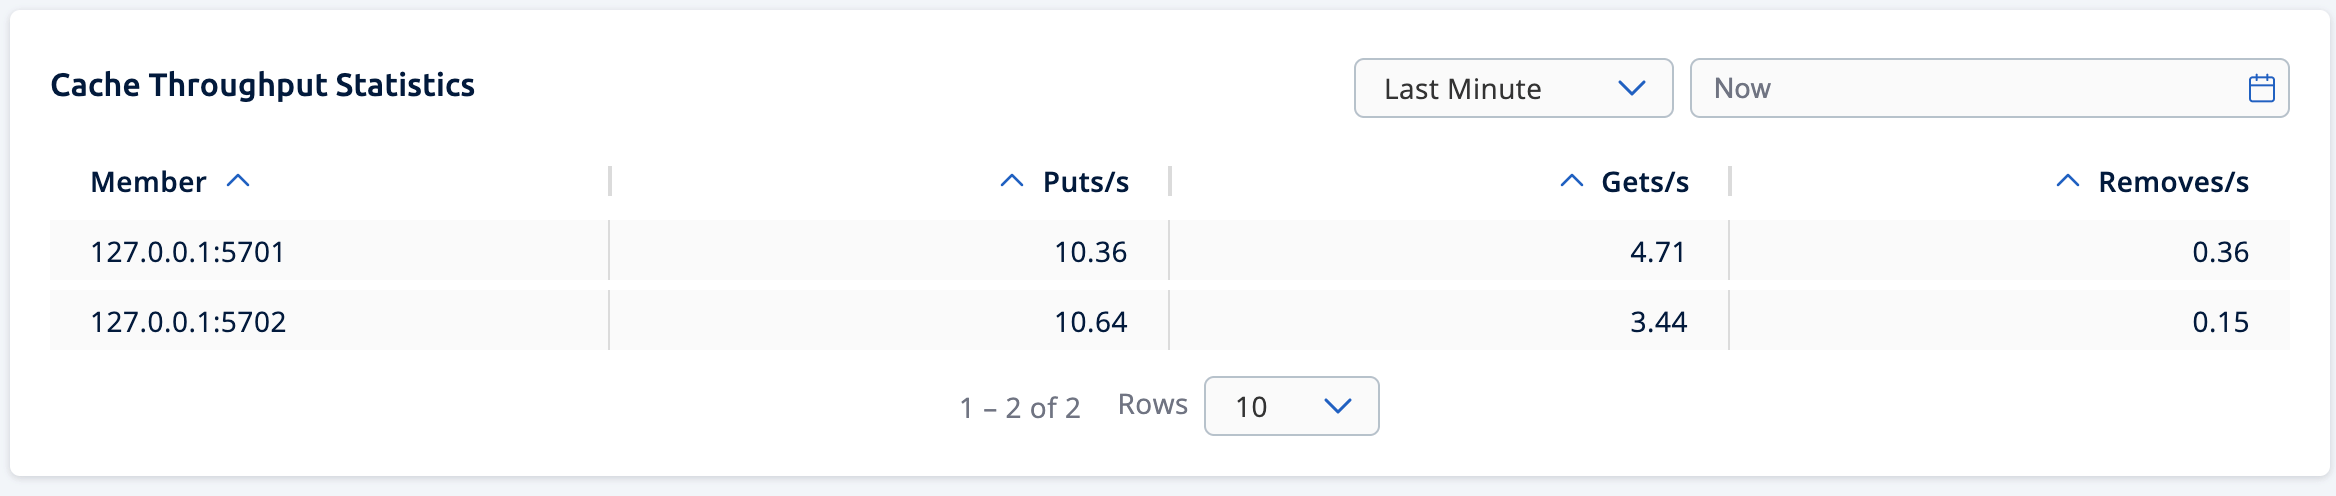
From left to right, this table lists the following:
-
IP address and port of each member.
-
Put, get and remove operation rates on each member for this cache.
You can select the period in the combo box placed at the top right corner of the window, for which the table data will be shown. Available values are Since Beginning, Last Minute, Last 10 Minutes and Last 1 Hour.
You can ascend or descend the order of the listings in each column by clicking on column headings.
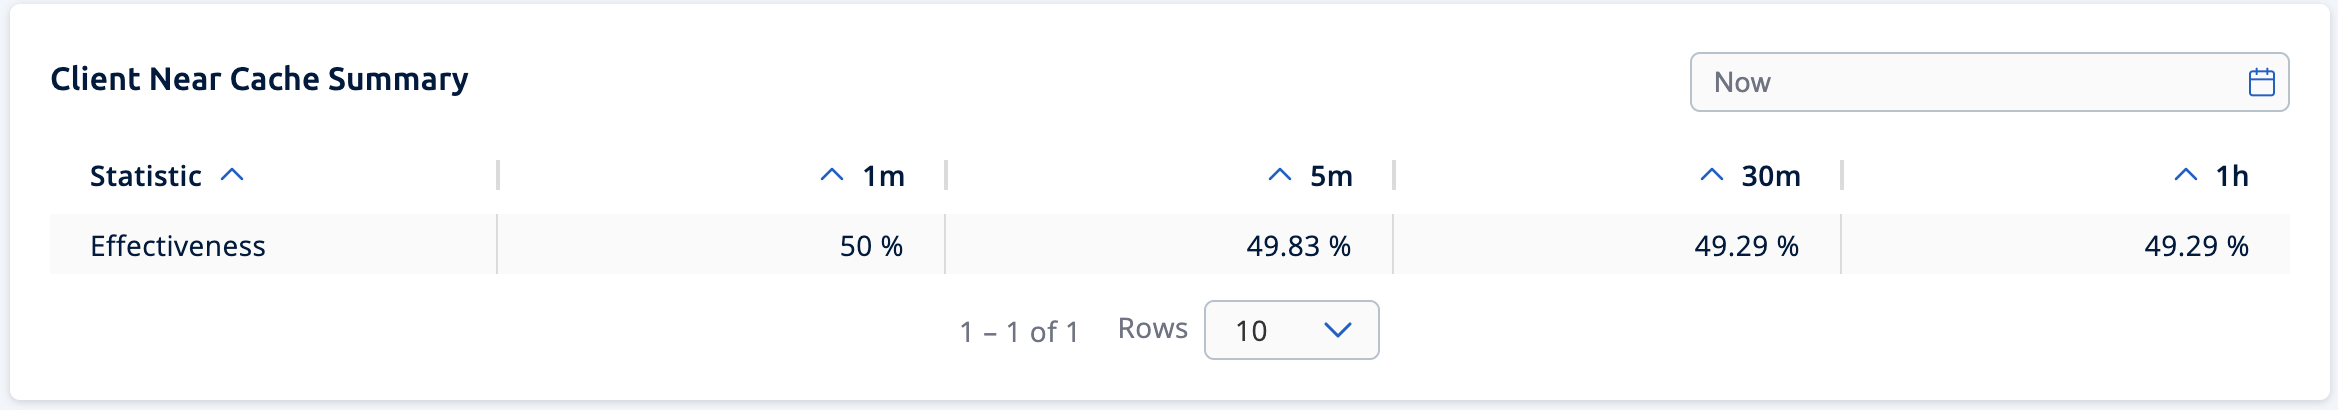
Client Near Cache Summary provides summary information related to the Near Cache statistics aggregated for all the clients that have Near Cache enabled for this cache. Aggregated statistics are shown for the following periods: 1 minute, 5 minutes, 30 minutes and 60 minutes. Currently, the table shows overall Near Cache effectiveness, calculated as hits/total reads ratio.
| You need to enable the statistics for clients to see them here. See the Monitoring Clients section for details. |
Client Near Cache Table provides information about the Near Caches statistics, if available, on each client that has Near Cache enabled for this cache, as shown below.
| You need to enable the statistics for clients to see them here. See the Monitoring Clients section for details. |
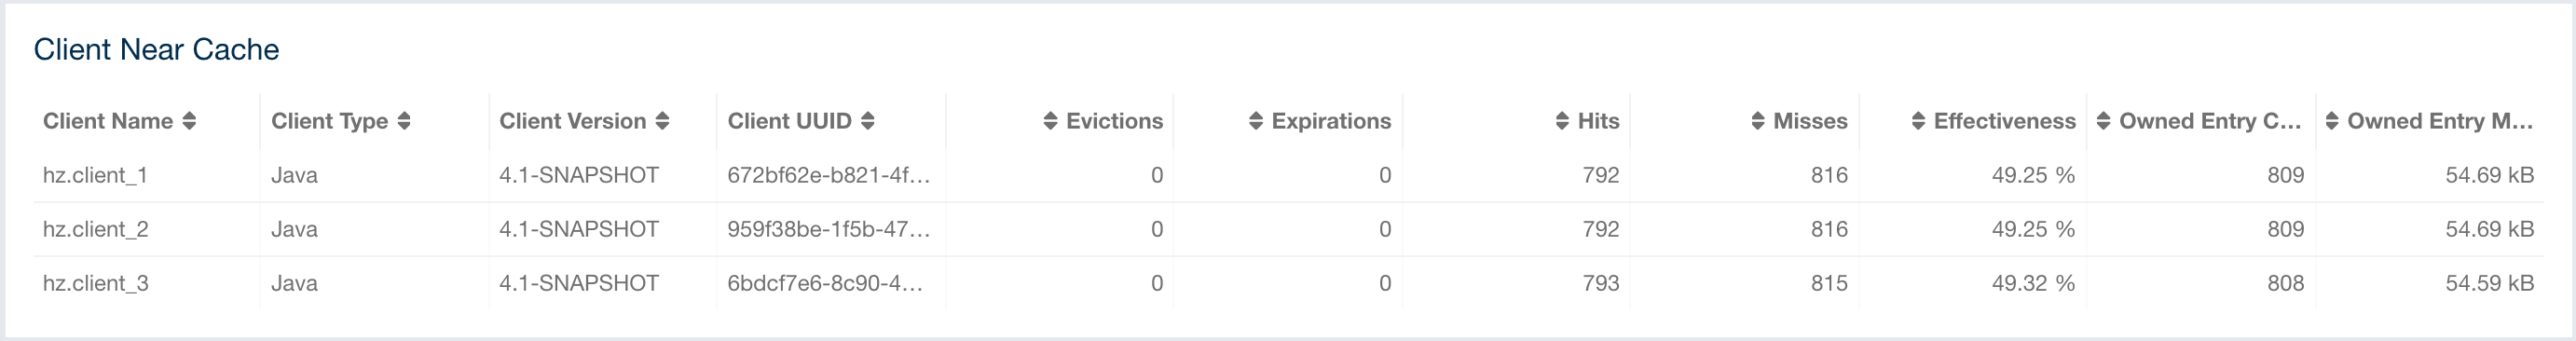
From left to right, this table lists the following:
| Field | Description |
|---|---|
Client Name |
Name of the client instance which has Near Cache enabled for the map. |
Client Type |
Type of the client. |
Client Version |
Version of the client. |
Client UUID |
Client unique identifier. |
Evictions |
Number of evictions of Near Cache entries owned by the client. |
Expirations |
Number of TTL and max-idle expirations of Near Cache entries owned by the client. |
Hits |
Number of hits (reads) of Near Cache entries owned by the client. |
Misses |
Number of misses of Near Cache entries owned by the client. |
Effectiveness |
Hits/total reads ratio. |
Owned Entry Count |
Number of Near Cache entries owned by the client. |
Owned Entry Memory Cost |
Memory cost of Near Cache entries owned by the client. |
To ascend or descend the order of the listings, click on the column headings.
You need to enable the statistics for caches to monitor them
in the Management Center. Use the <statistics-enabled> element or
setStatisticsEnabled() method in declarative or programmatic
configuration, respectively, to enable the statistics. Please refer
to the JCache Declarative Configuration
section for more information.
|