This page provides a general overview of the jobs in a Hazelcast Jet cluster.
Active Jobs
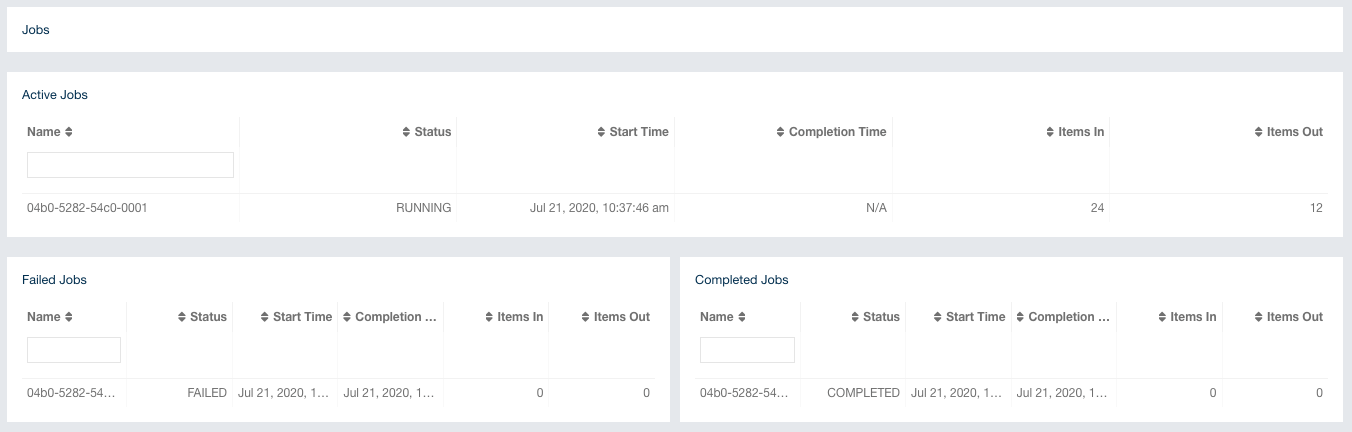
It shows the list of actively running jobs in the cluster:
-
Name: Name/ID of the job.
-
Status: Current status of the job.
-
Start Time: Start time of the job.
-
Completion Time: Completion time of the job.
-
Items In: Total number of items read from the sources of the jobs.
-
Items Out: Total number of items written to the sinks of the jobs.
Failed Jobs
It shows a list of failed jobs in the cluster with the following information:
-
Name: Name/ID of the job.
-
Status: Current status of the job.
-
Start Time: Start time of the job.
-
Completion Time: Completion time of the job.
-
Items In: Total number of items read from the sources of the jobs.
-
Items Out: Total number of items written to the sinks of the jobs.
Completed Jobs
It shows a list of completed jobs in the cluster with the following information:
-
Name: Name/ID of the job.
-
Status: Current status of the job.
-
Start Time: Start time of the job.
-
Completion Time: Completion time of the job.
-
Items In: Total number of items read from the sources of the jobs.
-
Items Out: Total number of items written to the sinks of the jobs.
You can click on a job to see a detailed view of it.
Job Details
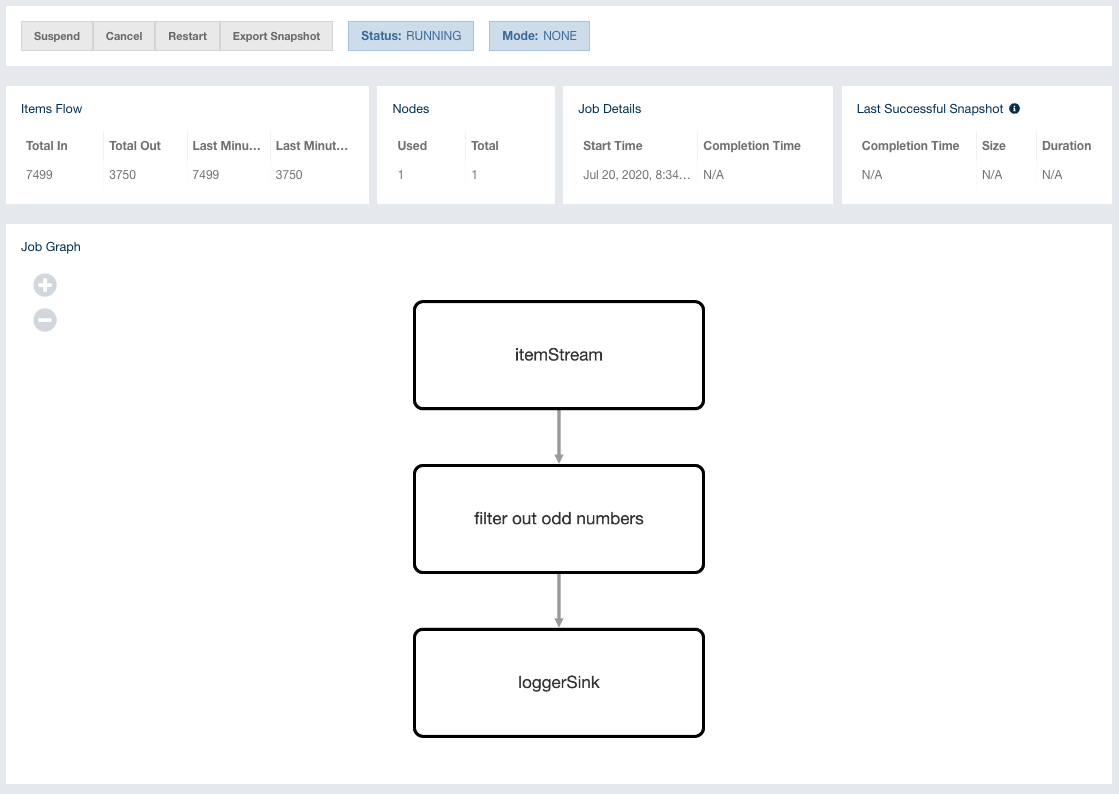
This page offers a tool for diagnosing data flow within the job. It provides graphical visualization of the stages, ability to manage the lifecycle of the job and allows you to peek into dataflow stats across the DAG. You can diagnose bottlenecks this way.
| You need to be an admin user to execute any of the actions below. |
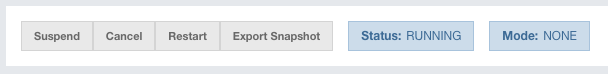
-
Suspend: Suspends the running job, only visible when the job is in the
RUNNINGstate. -
Resume: Resumes the suspended job, only visible when the job is in the
SUSPENDEDstate. -
Cancel: Stops the execution of the job.
-
Restart: Stops the execution of the job and starts a new execution for it.
-
Export Snapshot: Initiates a named snapshot export; exported snapshots can be managed via snapshots view.
-
Status: Current status of the job.
-
Mode: Processing guarantee mode of the job; either
None,At Least OnceorExactly Once.
Items Flow:
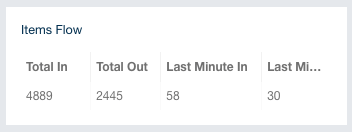
It shows the dataflow metrics for the cluster:
-
Total In: Total number of items read from the source of the job.
-
Total Out: Total number of items written to the sink of the job.
-
Last Min In: Number of items read from the source of the job in the last minute.
-
Last Min Out: Number of items written to the sink of the job in the last minute.
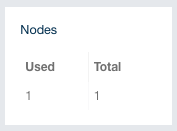
Nodes:
-
Used: Number of members used by the job.
-
Total: Number of total members in the cluster.
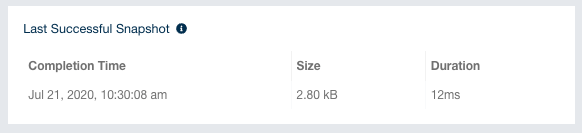
Last Successful Snapshot:
-
Completion Time: Latest successful snapshot completion time.
-
Size: Size of the snapshot.
-
Duration: Duration of the snapshot creation.
| These metrics are for only non-exported snapshots. |
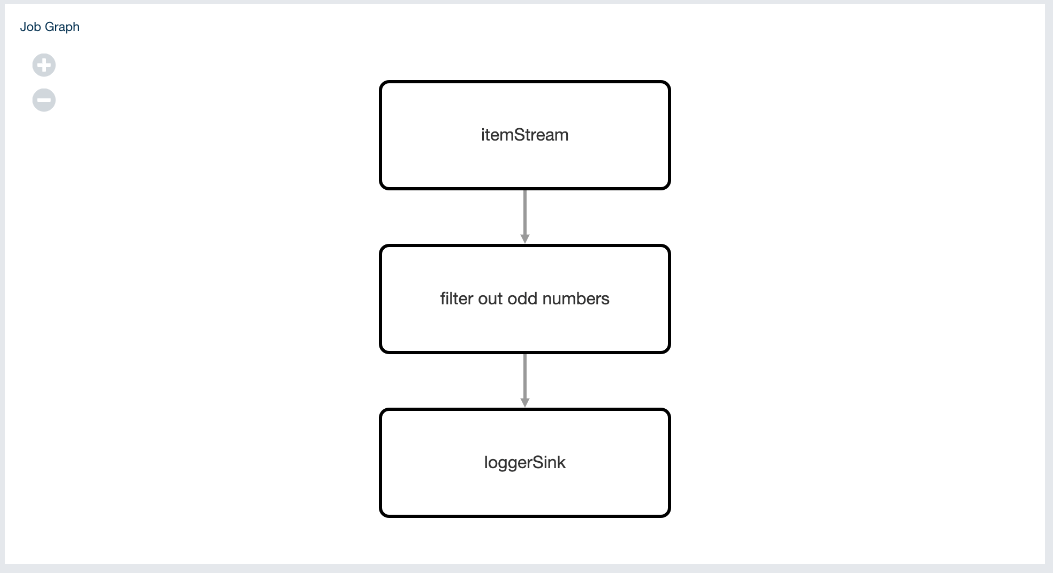
Job Visualization:
It is the graphical representation of the job topology.
Vertex Details:
It shows information about the selected vertex on the Job Visualization section.
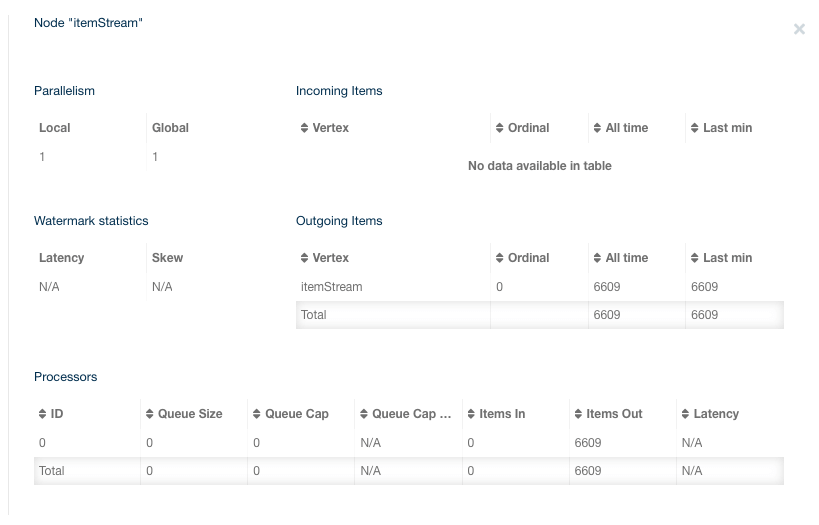
Parallelism::
-
Local: Number of processors running for that vertex on each member.
-
Global: Total number of processors running for that vertex on the cluster.
Incoming Items:
It lists all the incoming edges by their source vertices and shows the following information and totals for each of them.
-
All Time: Total number of items received by this vertex.
-
Last Min: Number of items received by this vertex in the last minute.
Outgoing Items:
It lists all the outgoing edges by their target vertices and shows the following information and totals for each of them.
-
All Time: Total number of items sent by this vertex.
-
Last Min: Number of items sent by this vertex in the last minute.
Watermark Statistics:
-
Latency: This is the time difference between wall-clock time and the last forwarded watermark (“event time, time of the stream”). Multiple factors contribute to the total latency, such as the latency in the external system, allowed lag (which is always included), clock drift and also long event-to-event intervals in any partition (this one is the trickiest). See here for more information.
-
Skew: This is the difference between latencies of the processor with the highest and lowest latencies. Most common cause is a long event-to-event interval in some source partition or an idle partition (until the idle timeout elapses). Overload of events in one partition can also cause it.
Processors:
It lists all the processors this vertex has in the cluster and shows the following information for each of them.
-
Queue Size: Current size of the processor inbox queue.
-
Queue Cap: Capacity of the processor inbox queue.
-
Queue Cap Usage: Queue utilization percentage.
-
Items In: Total number of items received by this processor.
-
Items Out: Total number of items sent by this processor.
-
latency: Time difference between the wall-clock time and the last forwarded watermark (“event time, time of the stream”). Multiple factors contribute to the total latency:
-
latency in the external system; events arrive already delayed to Jet source
-
allowed lag; if you allow for some time to wait for delayed events, watermarks will always be delayed by this lag. Note that the actual output might not be delayed.
-
event-to-event interval; if there is a time period between two events, the event time “stops” for that time. In other words, until a new event comes, Jet thinks the current time is the time of the last event. As “current event time” is tracked independently for each partition, this can be the major source of skew. If your events are irregular, you might consider adding heartbeat events. This factor also applies if you use
withIngestionTimestampssince a new wall-clock time is assigned only if new event arrives. -
time to execute map/filter stages; they contribute with the latency of the async call or with the time to execute CPU-heavy sync call.
-
internal processing latency of Jet; typically very low: 1 or 2 milliseconds. It can be higher if the network is slow, system is overloaded, if there are many vertices in the job or many jobs, which causes lot of switching, etc.
-
clock drift; since we’re comparing to the real time, latency can be caused by a clock drift between the machine where event time is assigned (which can be also be an end user’s device). It can even be negative. Always use NTP to keep wall-clock precise and avoid using timestamps from devices out of your control as event time.
-
Edge Details:
It shows information about the selected edge on the Job Visualization section.
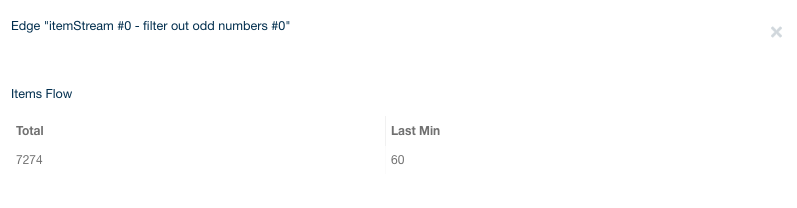
Items Flow:
-
Total: Total number of items passed through this edge.
-
Last Min: Number of items passed through this edge in the last minute.