Your clusters collect and report metrics data for the connected Management Center. Metrics data includes various number of time series, such as CPU load, memory consumption, and operation counters. See the Metrics section of the Hazelcast IMDG Reference Manual for details about configuring metrics collection.
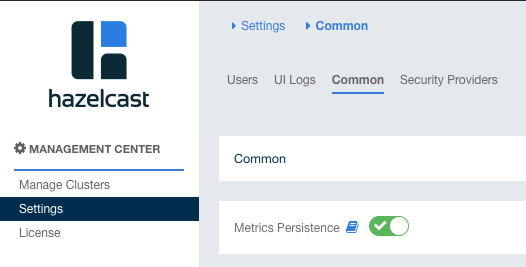
By default, Management Center persists the collected metrics on disk. You can turn off the switch with the "Metrics Persistence" label to disable on disk persistence for collected metrics data and have them stored only in memory.
Once it is ON, the metrics generated by your clusters will be stored on disk. You can configure the Time-to-Live setting to control how long metrics data points are kept on disk. By default, Management Center stores metrics data for one day.
Management Center stores the metrics in a database file, under the Management Center home directory
on the disk. The data files can be found in the <User‘s Home Directory>/hazelcast-mc/metrics
directory, e.g., /home/someuser/hazelcast-mc/metrics. This directory can be changed using
the hazelcast.mc.home property on the server where Management Center is running.
When on-disk persistence is enabled, you may see the following warning messages in the Management Center log:
Could not find 10230 metrics time series out of 100500 during background persistence run.
Consider increasing metrics in-memory cache size by setting `hazelcast.mc.metrics.inMemory.max.size` system property.
This message indicates that Management Center could not persist some of the collected
data points. That happens when the in-memory cache size is not enough to fit all metrics
generated by your clusters and its size should be increased. You can increase it by using
the hazelcast.mc.metrics.inMemory.max.size system property. This value is 300000 by default,
which is enough to store up to 3 minutes of data for 100,000 metrics.
| Each in-memory cache entry takes around 0.5 KB of memory, so you may have to increase the maximum heap size in JVM when changing this setting to a greater value. |
Using Metrics Persistence
The Metrics Persistence toggle item allows you to check the status of the cluster at a time in the past. You can select it on the Settings:
When you turn the switch on, you can go back in time using the date picker on the left corners of charts and check your cluster’s situation at the selected time. All the data structures and members can be monitored as if you are using the Management Center normally (charts and data tables for each data structure and members). It shows the status if metrics persistence has been ON at the selected time in the past; otherwise, it shows empty charts and tables.
You can press the Now button next to the date picker to see the latest data. Note that this will only show you the latest data on a chart and not cause the other charts and data tables to refresh.
Configuring RocksDB temporary directory
Management Center uses the RocksDB native library under the hood for metrics persistence. By default, the RocksDB binary
is extracted into the java.io.tmpdir directory. In case you run into any file system permission errors, you can override
this default by setting the ROCKSDB_SHAREDLIB_DIR environment variable to the absolute path of an other directory. See the following example:
mkdir $HOME/tmp/rocksdb
export ROCKSDB_SHAREDLIB_DIR="$(realpath $HOME/tmp/rocksdb)"
java -jar hazelcast-management-center-4.2021.06.jar