This is the first page appearing after logging in. It gives an overview of the connected cluster. The following subsections describe each portion of the page.
Memory Utilization
This part of the page provides information related to the memory usages for each member, as shown below:
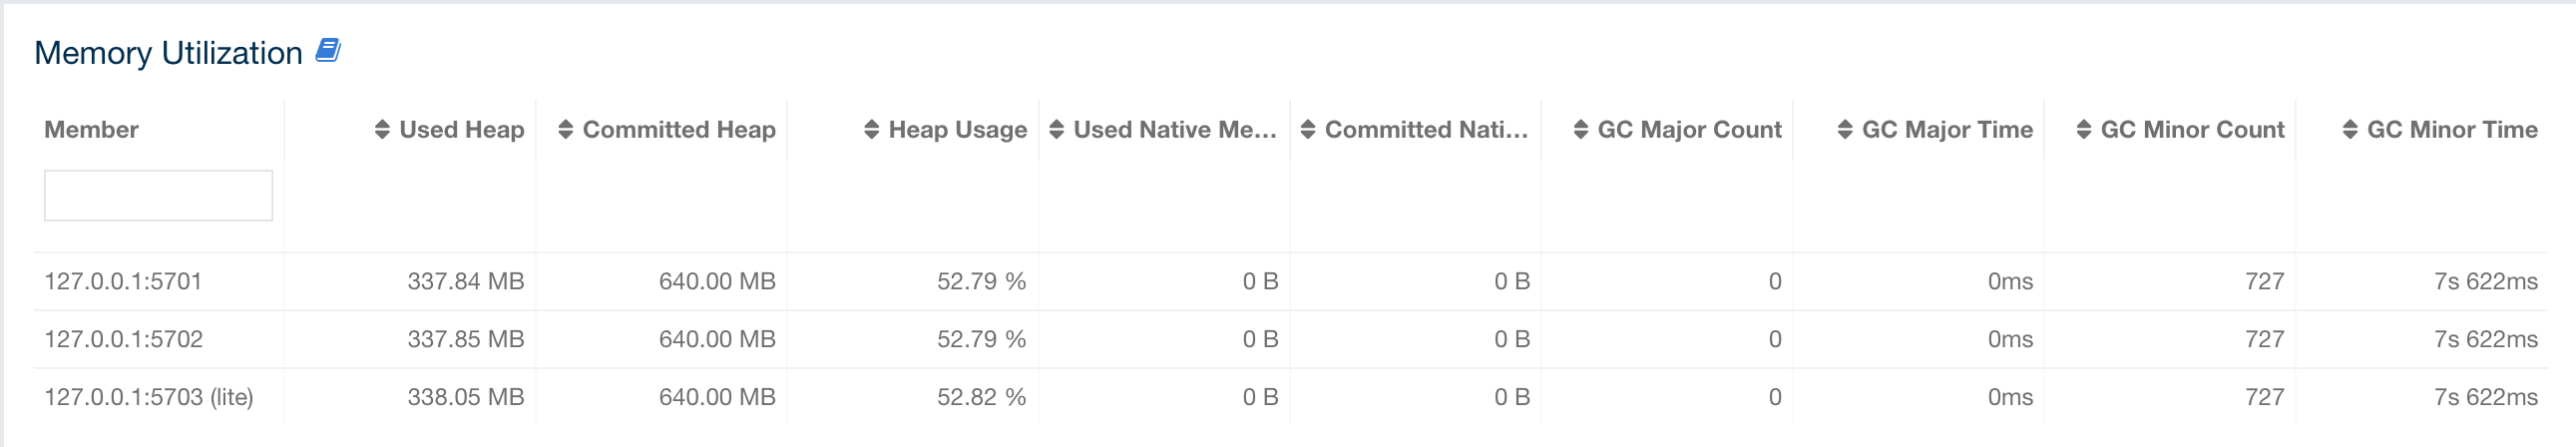
The first column lists the members with their IPs and ports. The next columns show the used and free memories out of the total memory reserved for Hazelcast IMDG usage, in real-time. The Committed Heap column lists the Java Heap memory capacity of each member, and the Heap Usage column lists the percentage value of used memory out of the committed heap memory. The Used Heap column shows how much the Java Heap memory is used of members graphically. The Committed Native Memory column lists the Java Off Heap memory reserved by Hazelcast IMDG member, and the Used Native Memory column shows how much Java Off Heap memory is used by members. When you move the mouse cursor on a desired graph, you can see the memory usage at the time point where the cursor is placed. Graphs under this column show the memory usages approximately for the last 2 minutes.
Heap Memory Distribution
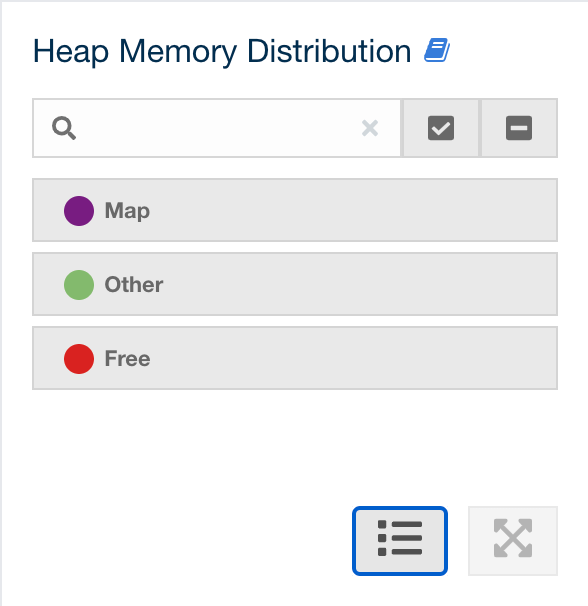
This part of the page graphically provides the cluster wise breakdown of heap memory, as shown below. The purple area is the heap memory used by the maps (including all owned/backup entries, any near cache usage and cost of the Merkle tree). The green area is the heap memory used by both non-Hazelcast entities and all Hazelcast entities except the map, i.e., the heap memory used by all entities subtracted by the heap memory used by map. The red area is the free heap memory out of the whole cluster’s total committed heap memory.
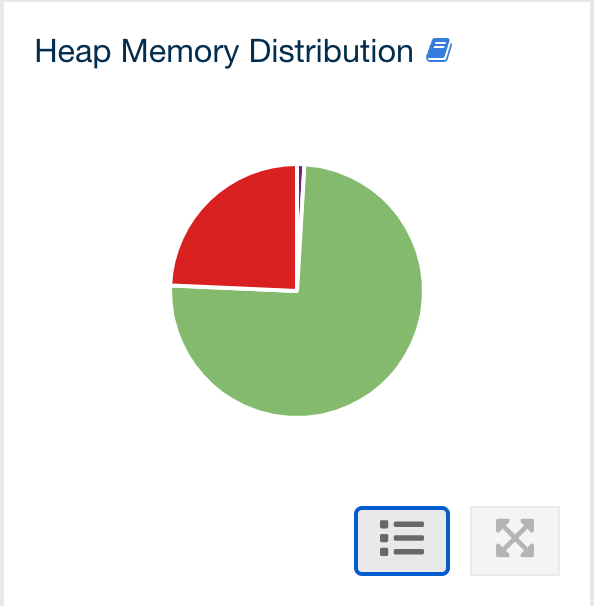
In the above example, you can see a small amount of the total heap memory is used by Hazelcast IMDG maps, about 25% is used by both non-Hazelcast entities and all Hazelcast entities except the map and the rest of the total heap memory is free. You can see the exact percentages by placing the mouse cursor on the chart.
Cluster State/Health/Client Filtering/CP Subsystem
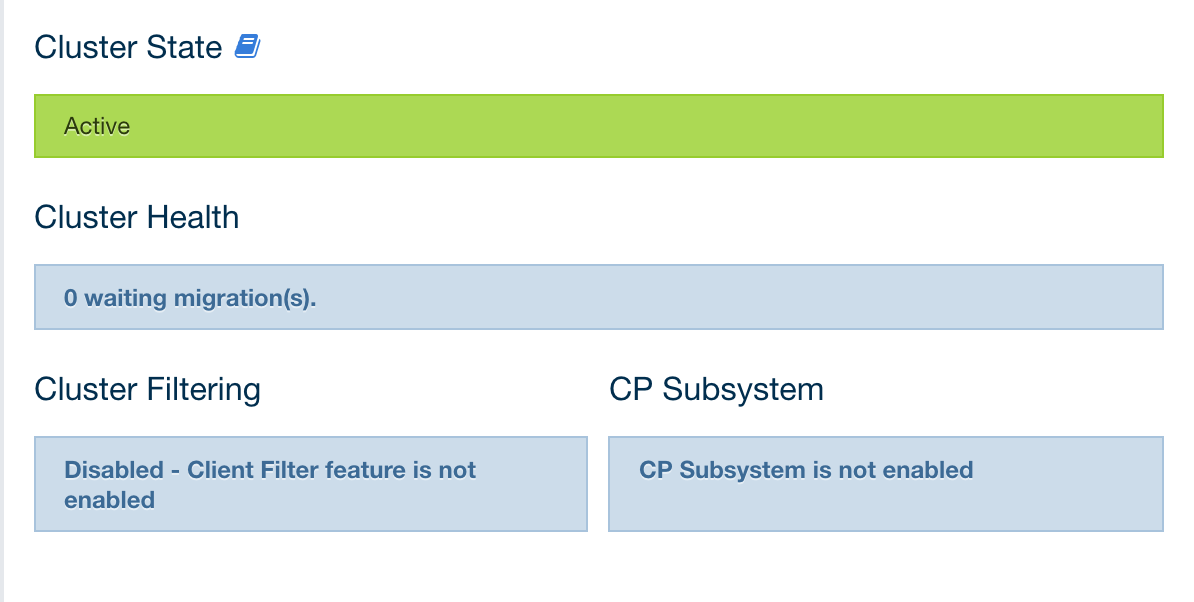
This part has the following status indicator elements:
-
Cluster State: Shows the current cluster state. For more information on cluster states, see the Cluster State section.
-
Cluster Health: Shows how many migrations are taking place currently.
-
Client Filtering: Shows values for the current cluster client filtering status and type. For more information on the cluster client filtering, see the Changing Cluster Client Filtering section.
-
CP Subsystem: Shows the CP subsystem status. For more information on the CP subsystem support in the Management Center, see the CP Subsystem section.
| Cluster client filtering is only available with Hazelcast IMDG license that includes the Cluster Client Filtering feature. |
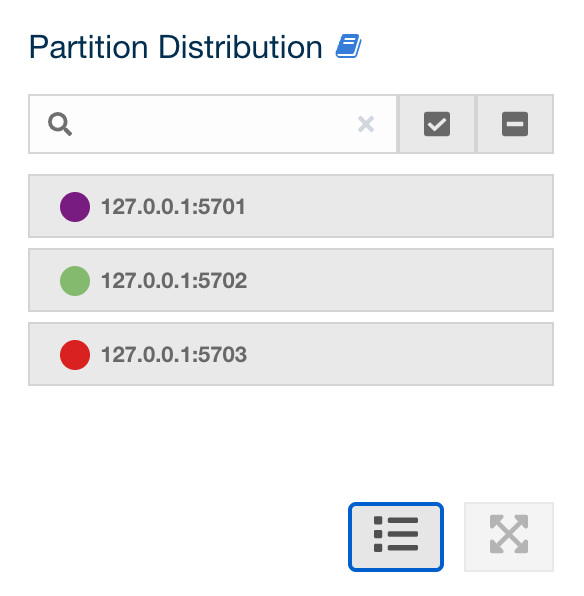
Partition Distribution
This chart shows what percentage of partitions each cluster member has, as shown below:
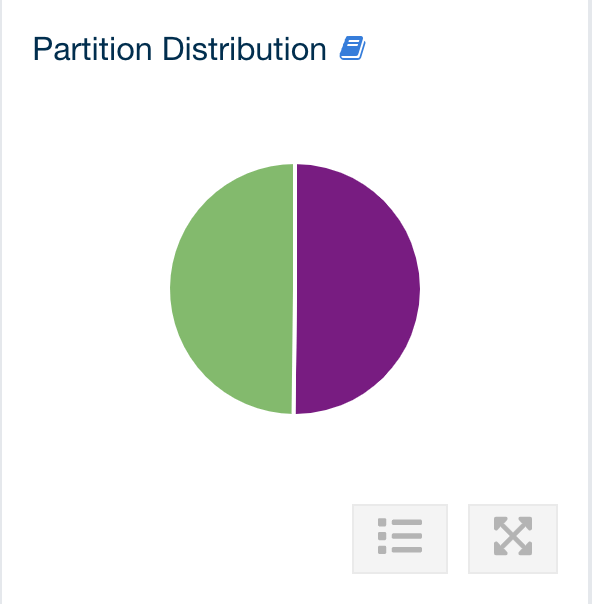
You can see each member’s partition percentages by placing the mouse cursor on the
chart. In the above example, you can see that two members out of three share
the total partition count (which is 271 by default and configurable; see the hazelcast.partition.count
property explained in the System Properties appendix of
the Hazelcast IMDG Reference Manual).
The partition distribution chart does not show any information
until you create your distributed objects. When you add new members to your cluster,
there will be no partition migration since partitions do not exist yet. Once you connect
to your cluster and, for example, create a map (using hazelcastInstance.getMap()),
only then this chart starts to show partition distribution information.
|
CPU Utilization
This part of the page provides load and utilization information for the CPUs for each cluster member, as shown below:
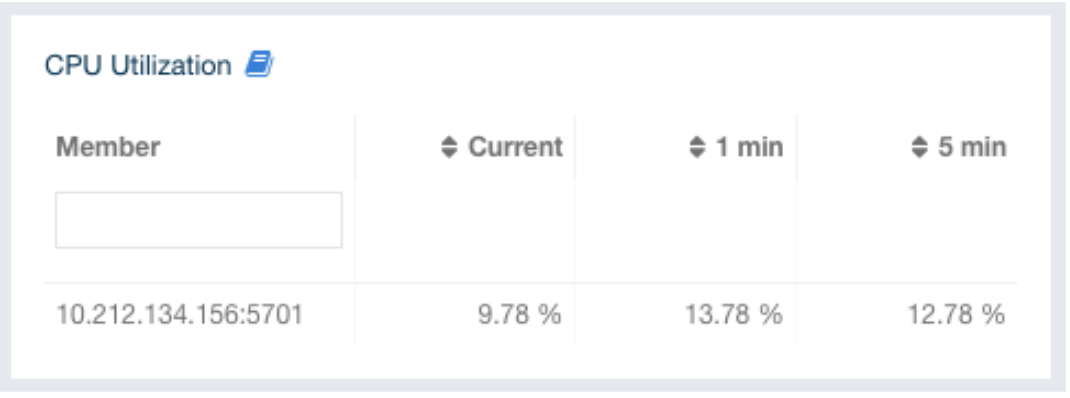
The first column lists the members with their IPs and ports. The next columns list the system load averages on each member for the current moment, last 1 and 5 minutes. These average values are calculated as the sum of the count of runnable entities running on and queued to the available CPUs averaged over the moment being, last 1 and 5 minutes. This calculation is operating system specific, typically a damped time-dependent average. If system load average is not available, these columns show negative values.
Widgets
The dashboard shows two widgets that show various metrics of the cluster. See the Widget section for more information.