Use this menu item to monitor each cluster member and perform operations like running garbage collection (GC) and taking a thread dump.
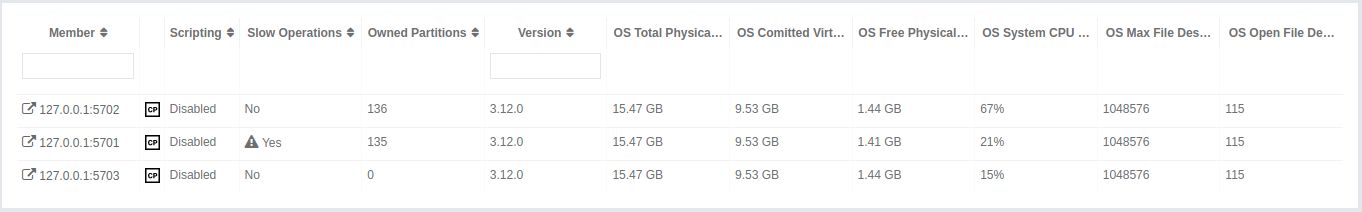
You can see a list of all the members in your cluster by clicking on the Members menu item on the left panel. A new page is opened on the right, as shown below.
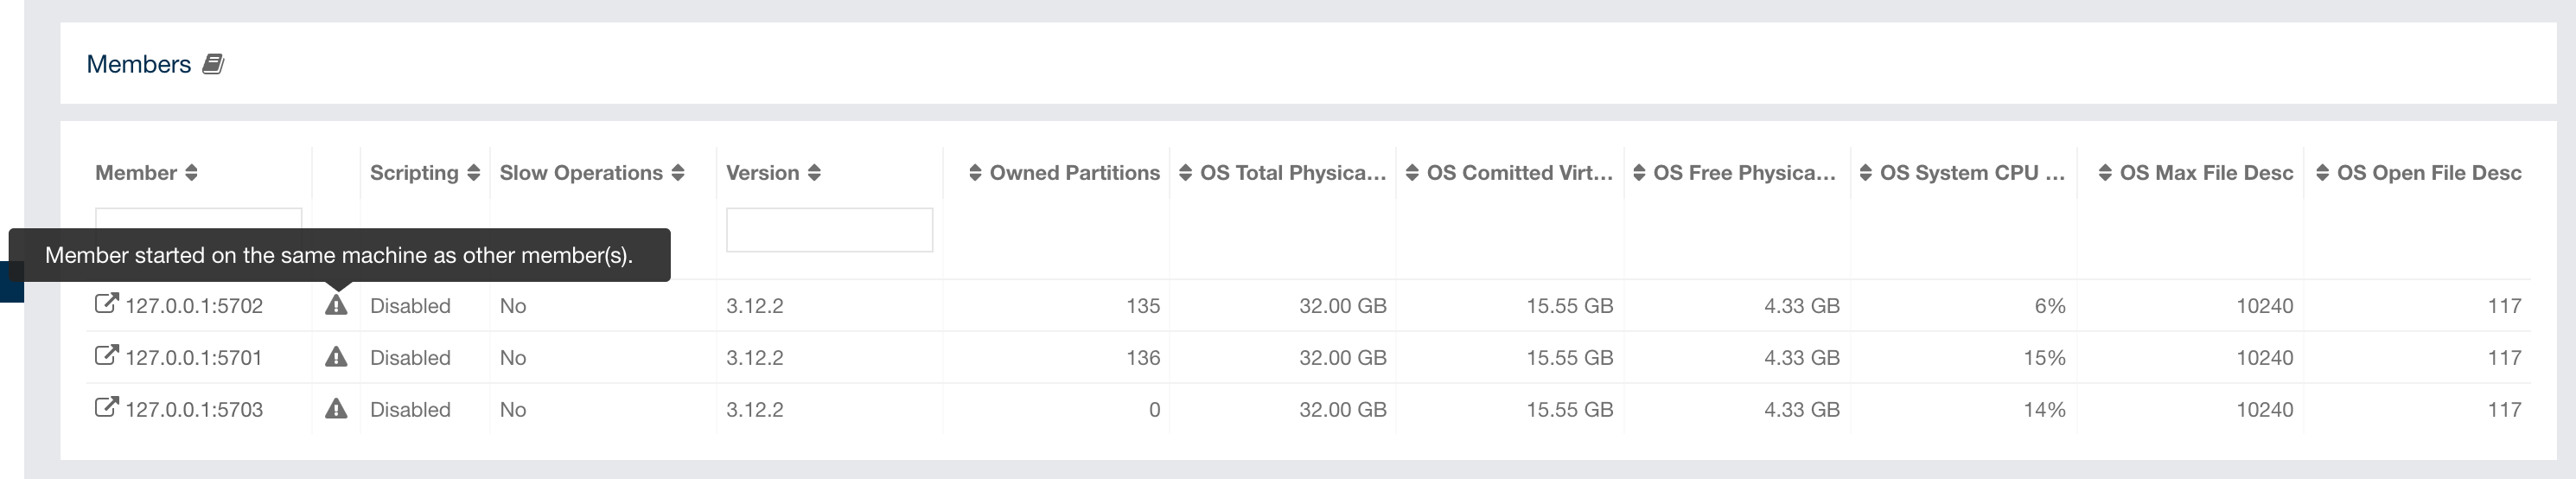
| You may see a warning icon with exclamation mark in the list when your runtime or hardware configuration does not follow the performance recommendations. See IMDG Deployment and Operations Guide for more information. |
You can filter the members shown and you can also sort the table by clicking on the column headers. Members that participate in the CP subsystem are marked with the CP icon. Clicking on a member name opens a new page for monitoring that member on the right, as shown below.
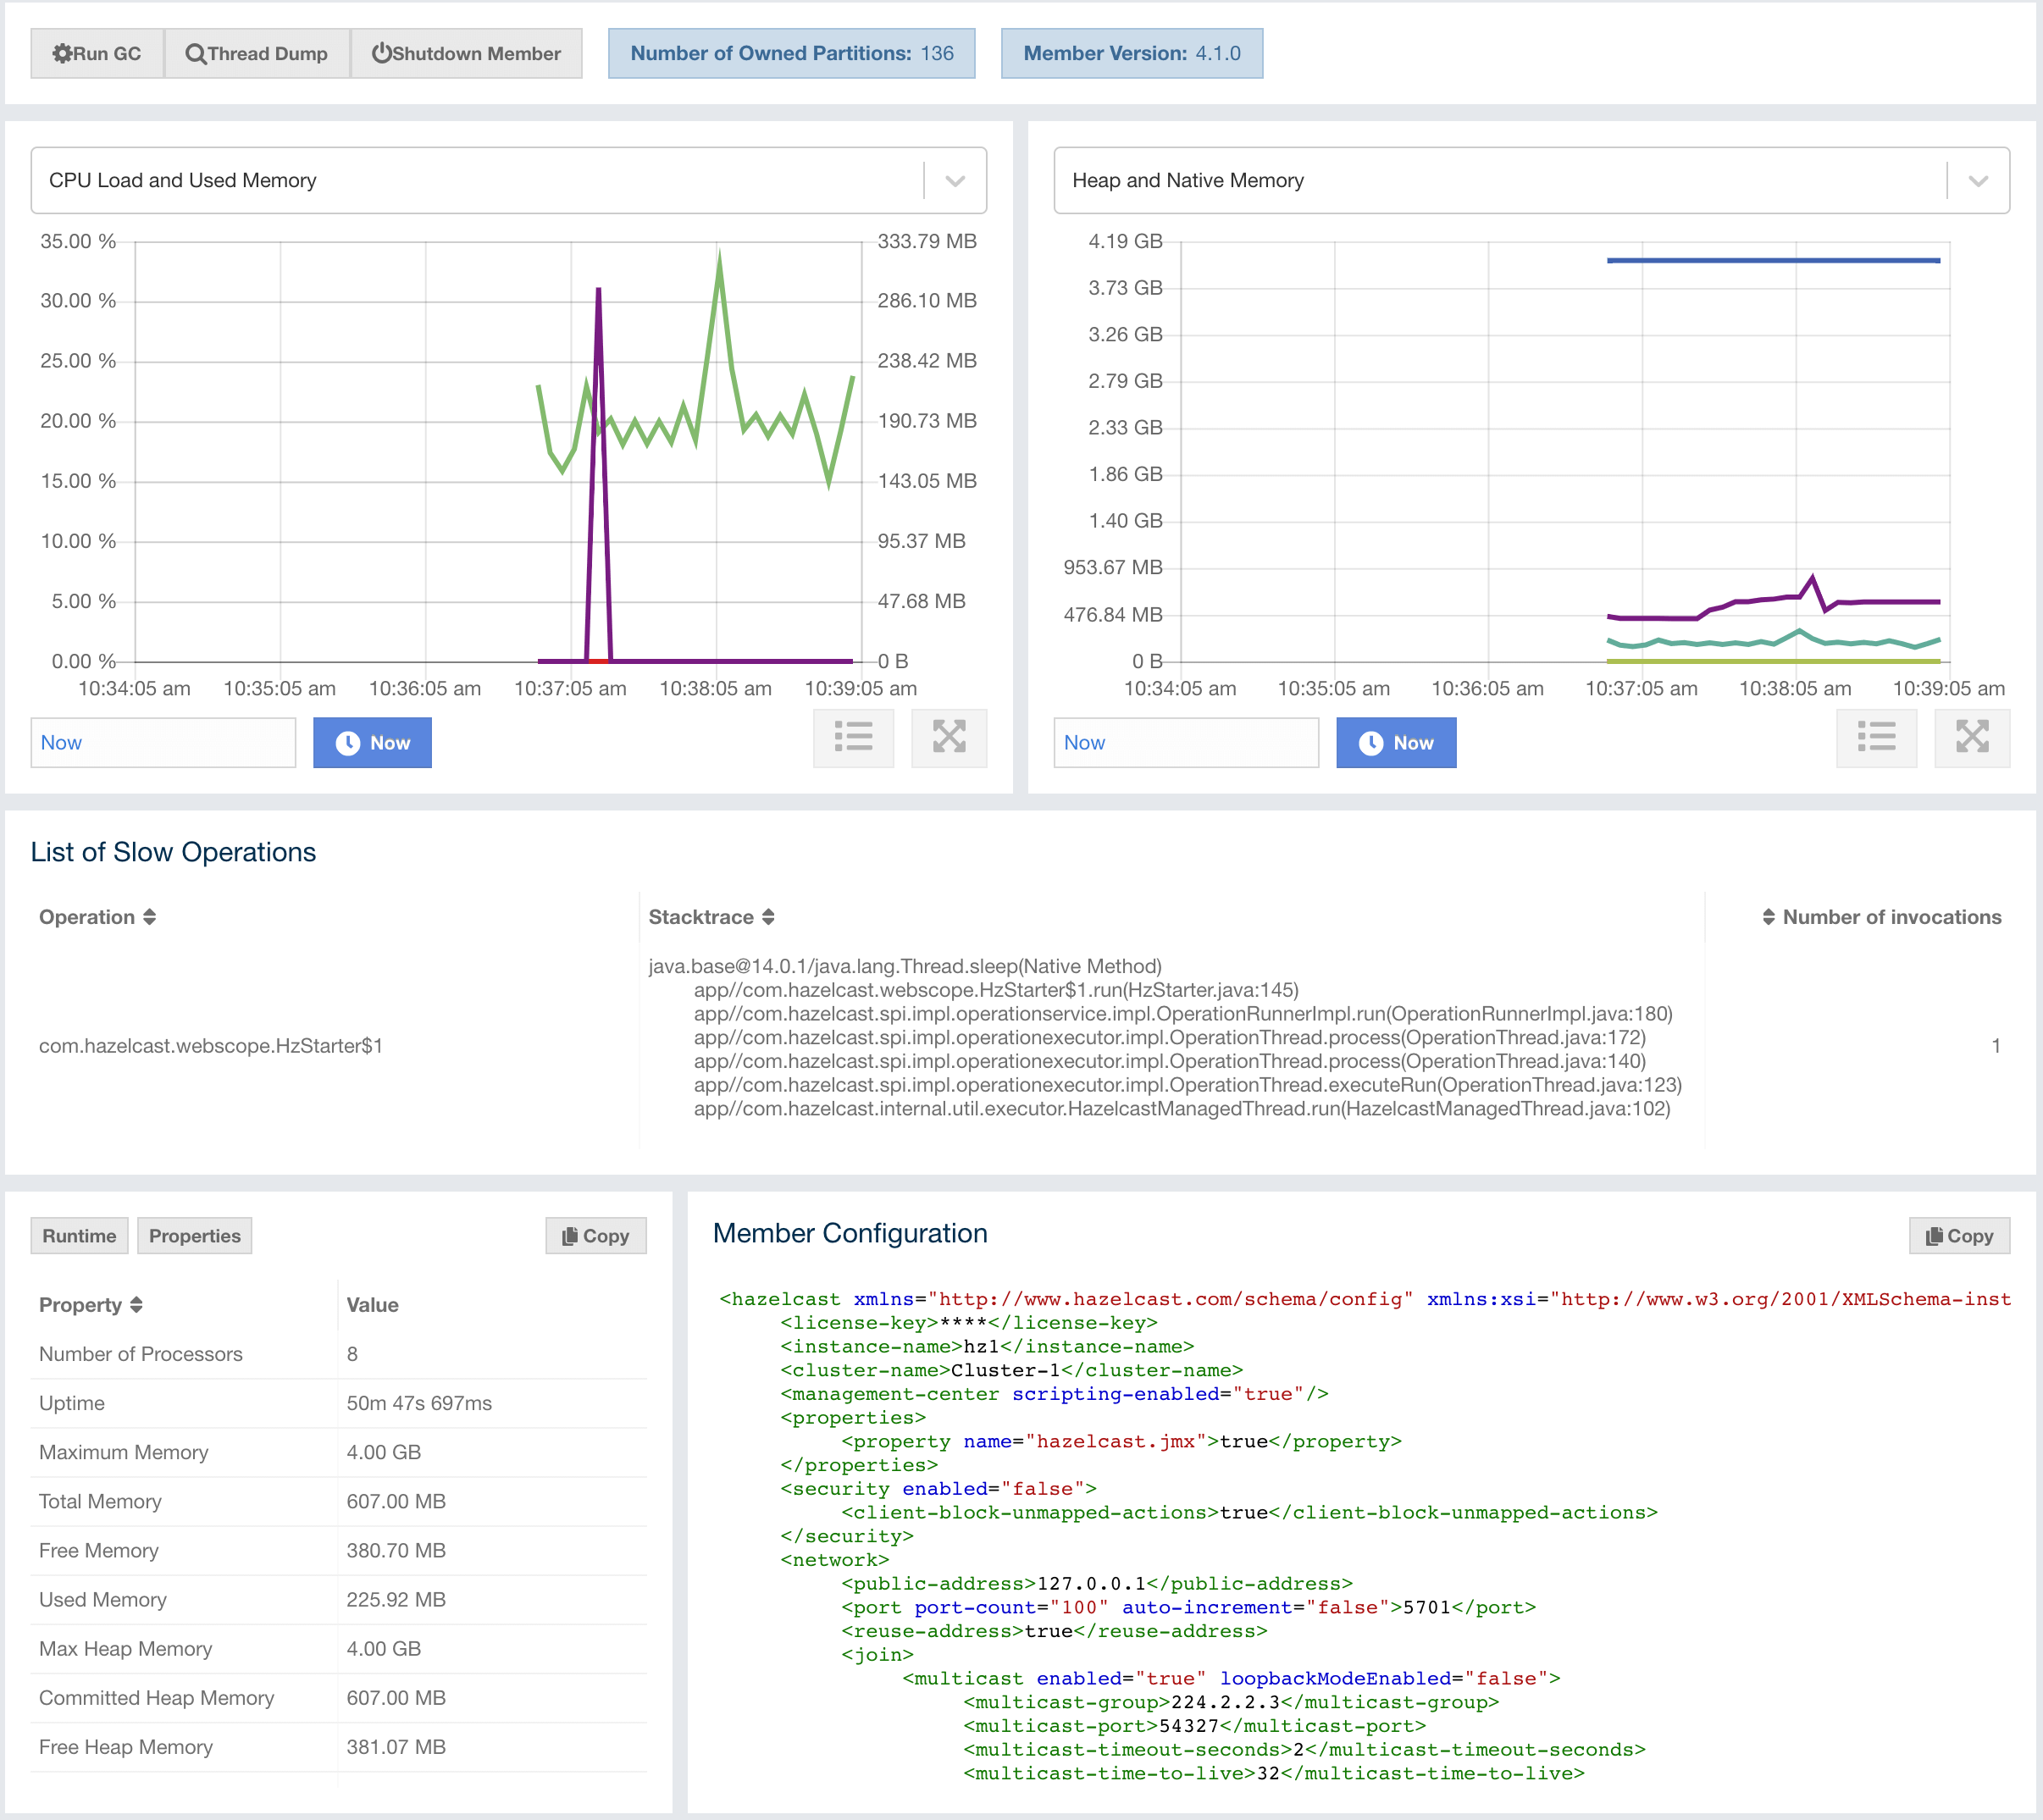
You can perform the following operations on the selected member using the buttons located at the top left of the page:
-
Run GC: Executes garbage collection on the selected member. A notification stating that the GC execution was successful is shown.
-
Thread Dump: Takes a thread dump of the selected member and shows it in a separate dialog.
-
Shutdown Member: Shuts down the selected member.
-
Promote Member: It is only shown for the lite members. When pressed, the lite member becomes a data member.
| Shutdown member operation requires enabled REST API in the IMDG cluster. See the IMDG documentation for more information. |
Next to the above operation buttons, you can see the informative buttons as described below:
-
Number of Owned Partitions: Shows how many partitions are assigned to the selected member.
-
Member Version: Shows the Hazelcast IMDG cluster version which the selected member belongs to.
-
CP Member UUID: Shows CP member UUID if the member participates in the CP subsystem of the cluster.
The CPU Utilization chart shows the percentage
of CPU usage on the selected member. The Heap/Memory
Utilization charts show the memory usage on the
selected member with three different metrics
(maximum, used and total memory). You can open
each chart as a separate dialog using
the  button
placed at top right of them; this gives you
a clearer view of the chart.
button
placed at top right of them; this gives you
a clearer view of the chart.
Runtime is a dynamically updated window tab showing the processor number, the start and up times, and the maximum, total and free memory sizes of the selected member. These values are collected from the default MXBeans provided by the Java Virtual Machine (JVM). Descriptions from the Javadocs and some explanations are below:
-
Number of Processors: Number of processors available to the member (JVM).
-
Start Time: Start time of the member (JVM) in milliseconds.
-
Up Time: Uptime of the member (JVM) in milliseconds
-
Maximum Memory: Maximum amount of memory that the member (JVM) will attempt to use.
-
Free Memory: Amount of free memory in the member (JVM).
-
Used Heap Memory: Amount of used memory in bytes.
-
Max Heap Memory: Maximum amount of memory in bytes that can be used for memory management.
-
Used Non-Heap Memory: Amount of used memory in bytes.
-
Max Non-Heap Memory: Maximum amount of memory in bytes that can be used for memory management.
-
Total Loaded Classes: Total number of classes that have been loaded since the member (JVM) has started execution.
-
Current Loaded Classes: Number of classes that are currently loaded in the member (JVM).
-
Total Unloaded Classes: Total number of classes unloaded since the member (JVM) has started execution.
-
Total Thread Count: Total number of threads created and also started since the member (JVM) started.
-
Active Thread Count: Current number of live threads including both daemon and non-daemon threads.
-
Peak Thread Count: Peak live thread count since the member (JVM) started or peak was reset.
-
Daemon Thread Count: Current number of live daemon threads.
-
OS: Free Physical Memory: Amount of free physical memory in bytes.
-
OS: Committed Virtual Memory: Amount of virtual memory that is guaranteed to be available to the running process in bytes.
-
OS: Total Physical Memory: Total amount of physical memory in bytes.
-
OS: Free Swap Space: Amount of free swap space in bytes. Swap space is used when the amount of physical memory (RAM) is full. If the system needs more memory resources and the RAM is full, inactive pages in memory are moved to the swap space.
-
OS: Total Swap Space: Total amount of swap space in bytes.
-
OS: Maximum File Descriptor Count: Maximum number of file descriptors. File descriptor is an integer number that uniquely represents an opened file in the operating system.
-
OS: Open File Descriptor Count: Number of open file descriptors.
-
OS: Process CPU Time: CPU time used by the process on which the member (JVM) is running in nanoseconds.
-
OS: Process CPU Load: Recent CPU usage for the member (JVM) process. This is a double with a value from 0.0 to 1.0. A value of 0.0 means that none of the CPUs were running threads from the member (JVM) process during the recent period of time observed, while a value of 1.0 means that all CPUs were actively running threads from the member (JVM) 100% of the time during the recent period being observed. Threads from the member (JVM) include the application threads as well as the member (JVM) internal threads.
-
OS: System Load Average: System load average for the last minute. The system load average is the average over a period of time of this sum: (the number of runnable entities queued to the available processors) + (the number of runnable entities running on the available processors). The way in which the load average is calculated is operating system specific but it is typically a damped time-dependent average.
-
OS: System CPU Load: Recent CPU usage for the whole system represented as a percentage value.
0%means that all CPUs were idle during the recent period of time observed, while100%means that all CPUs were actively running during the recent period being observed.
| These descriptions may vary according to the JVM version or vendor. |
The Member Configuration window shows the XML configuration of the connected Hazelcast cluster.
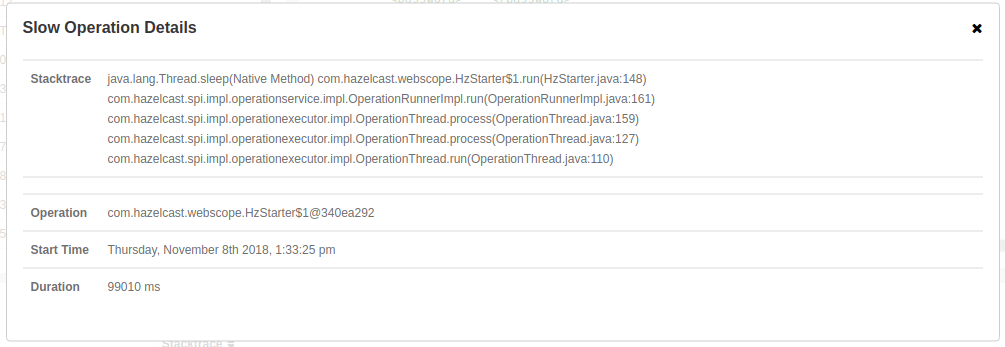
The List of Slow Operations gives an overview of detected slow operations which occurred on that member. The data is collected by the SlowOperationDetector.

Click on an entry to open a dialog which shows the stacktrace and detailed information about each slow invocation of this operation.