In this chapter, we briefly go over the toolbar and left menu items of the user interface itself, regardless of which cluster we monitor (IMDG or Jet). For now, you can ignore the body content which shows the cluster data. Those are explained in the following chapters throughout this document.
The following is the Management Center user interface:
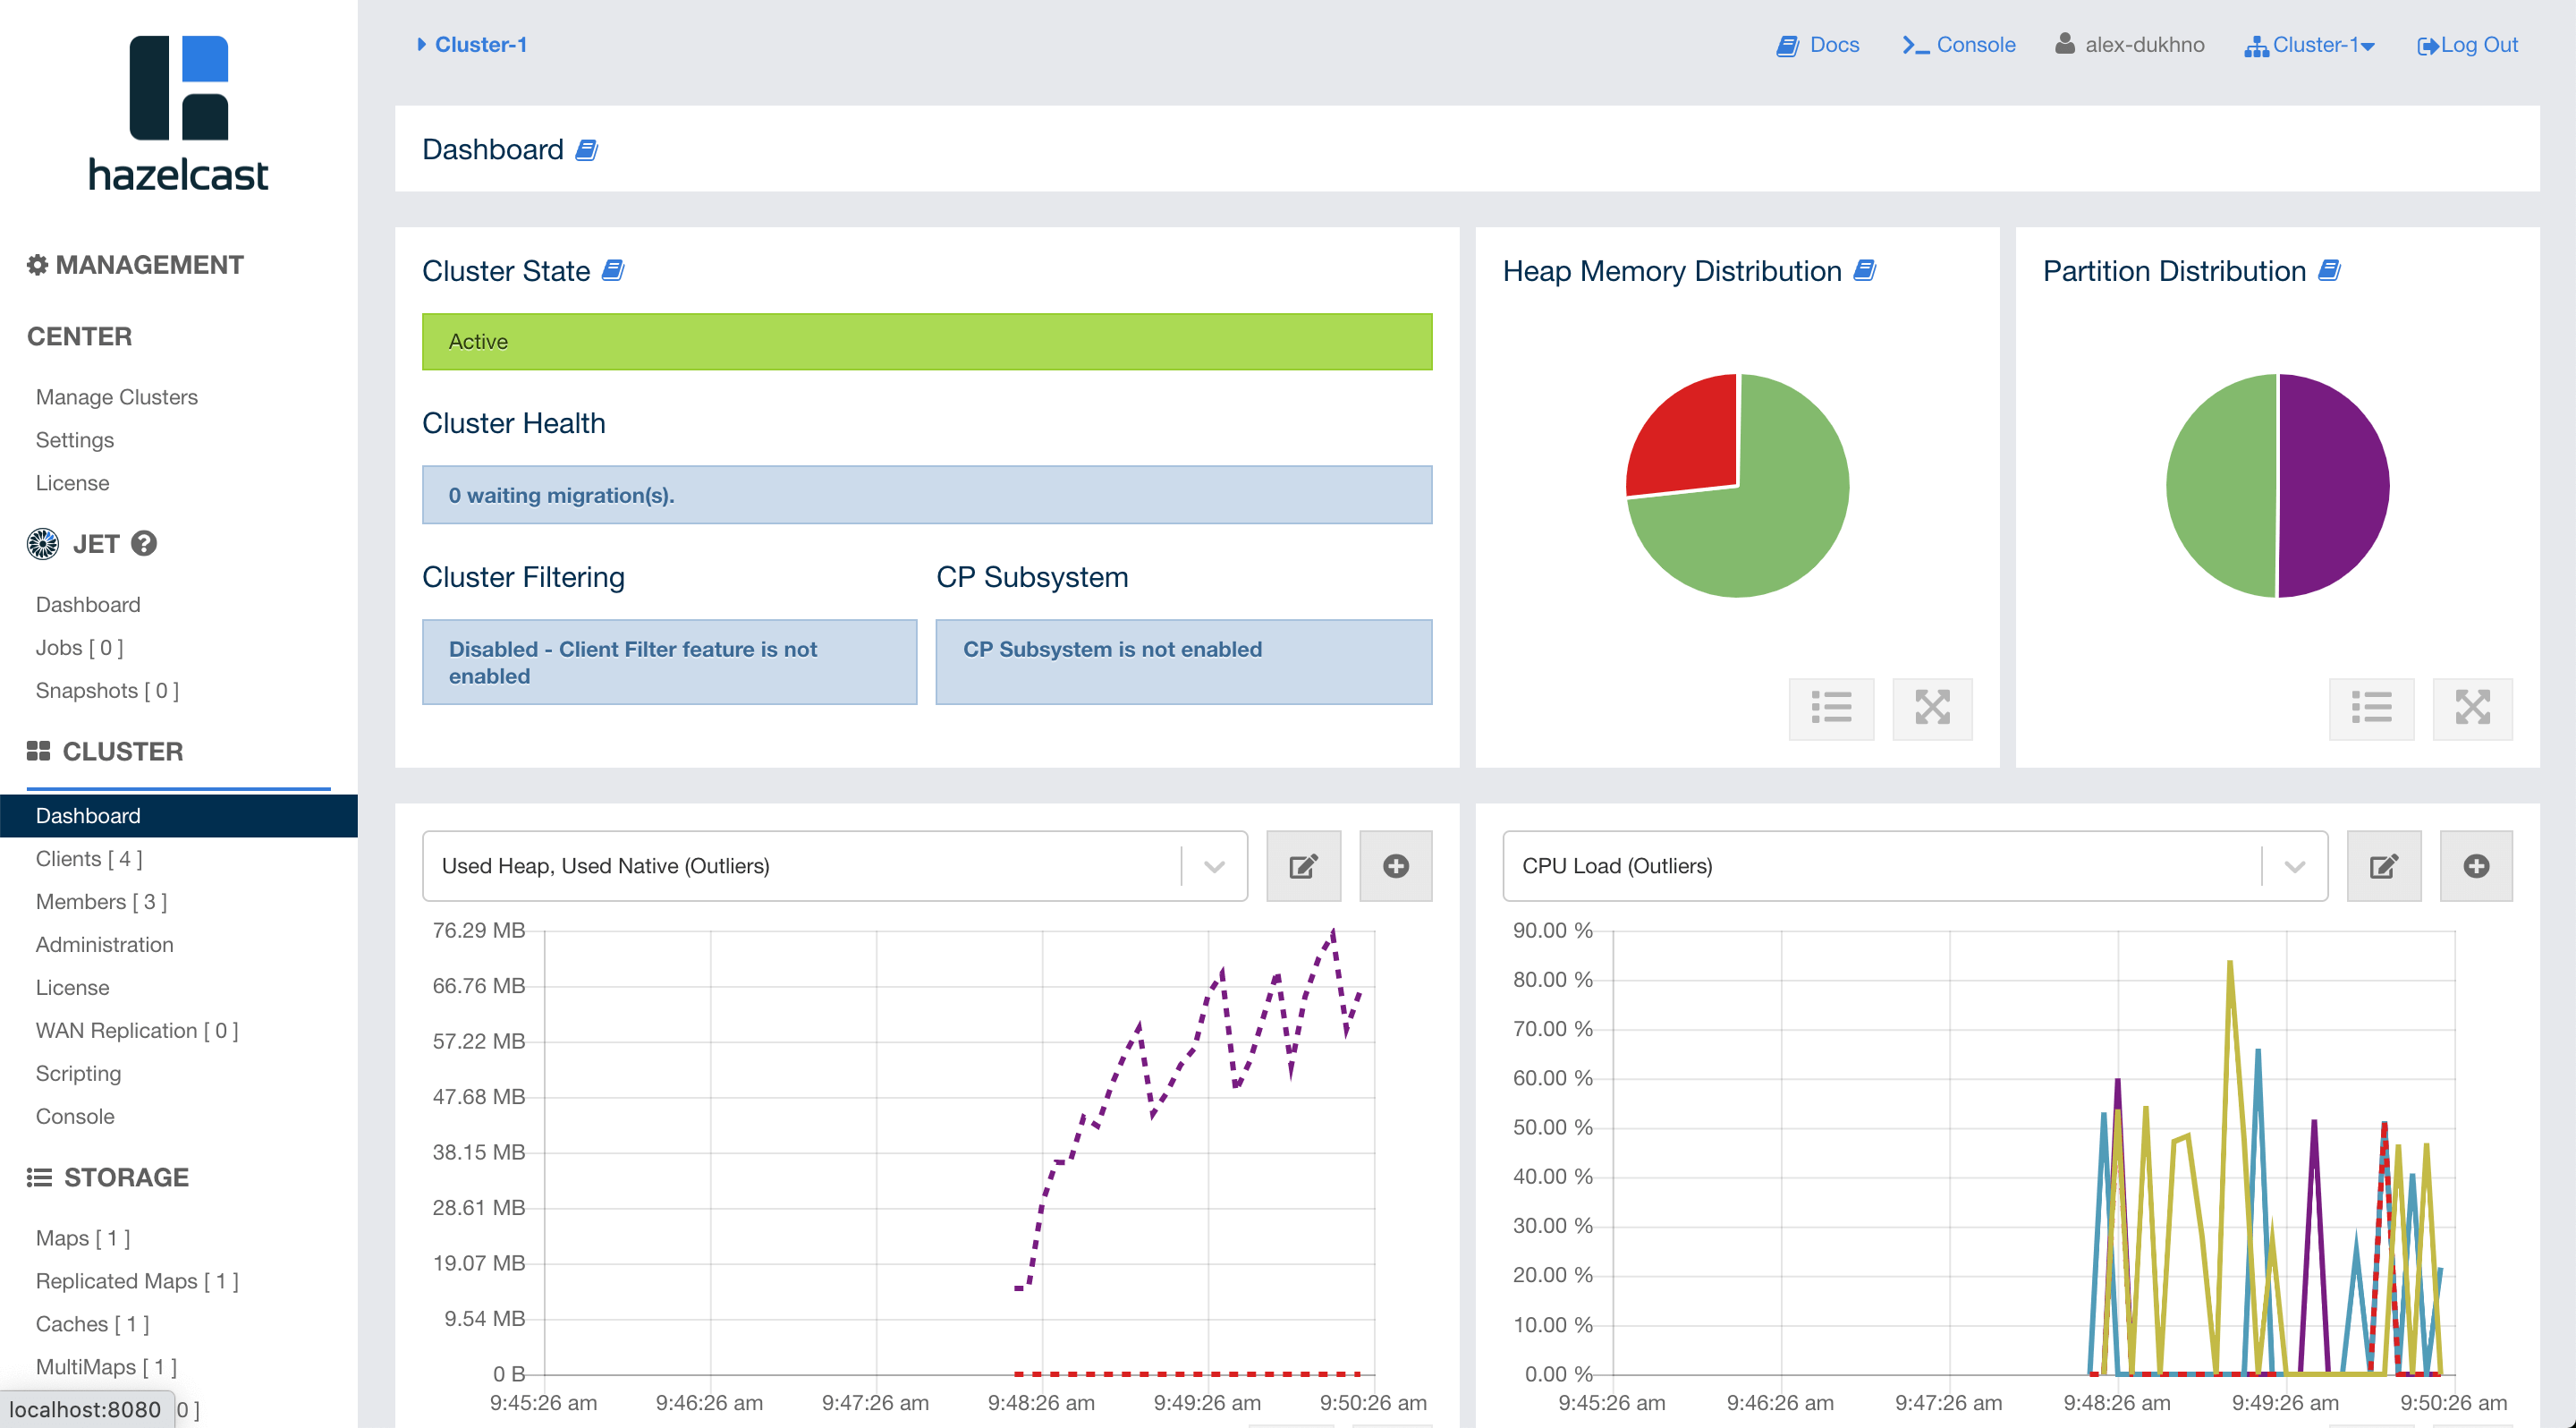
The user interface has a toolbar on the top and a menu on the left.
Toolbar

The toolbar has the following elements:
-
Docs: Opens the Management Center documentation in a new browser tab.
-
Console: Opens the in-page console so that you can easily execute commands in your cluster. See the Executing Console Commands chapter. Note that this top menu item appears only when you select a cluster to monitor.
-
User name: Shows the current user’s name. When you hover your mouse cursor onto it, the user’s last login time is shown as a tooltip, for security purposes.
-
Cluster Selector: Switches between the clusters. When clicked on, a dropdown list of available clusters appears. You can select any cluster; once selected, the page immediately loads with the selected cluster’s information. This selector has the same functionality as selecting a cluster in the "Manage Clusters" menu of the user interface.
-
Logout: Closes the current user’s session.
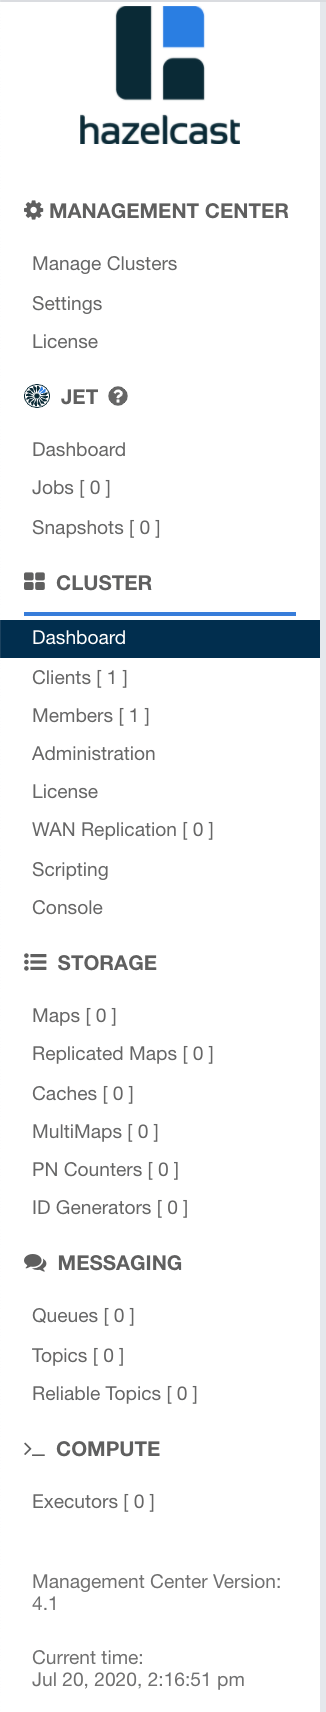
Menu
The Management Center user interface includes a menu on the left which lists the data structures and jobs in your clusters, cluster members and clients connected to the cluster (numbers in square brackets show the instance count for each entity), as shown below. You can also see an overview state of your cluster, execute commands and scripts, and perform user/license operations using this menu:
| WAN Replication button is only visible with the Hazelcast IMDG Enterprise license. |
The menu consists of the following parent menu headings:
-
MANAGEMENT CENTER: Includes menu items to manage clusters, user and license operations, and examine the user interface logs.
-
JET: Includes menu items to export snapshots and manage Jet jobs.
-
CLUSTER: Includes menu items for general cluster operations, monitoring clients/cluster members and executing scripts/commands.
-
STORAGE: Includes menu items to monitor data structures such as the maps, caches and PN counters in your cluster.
-
MESSAGING: Includes menu items to monitor queues and topics in your cluster.
-
COMPUTE: Includes the "Executors" menu item to monitor the executor services in your cluster.
| If you have not selected a cluster to monitor, only the "Management Center" menu items are shown in the user interface. |
The following sections describe each menu item from top to bottom.