Troubleshooting Management Center
This section describes how to deal with known issues and also how to read the user interface logs of Management Center.
Automated Security Scanning
When you scan Management Center artifacts, your tool might warn you about the following vulnerabilities. Management Center security is not affected by them. It uses a custom version of H2DB which is patched against these vulnerabilities.
Horizontal Scrollbar in Tables when Using Mac
Mac automatically shows a horizontal scrollbar in the status tables of Management Center, when you scroll through a table content.
The scrollbar should hide shortly after you stop scrolling. This is the default behavior and it shouldn’t cause any inconvenience. However, if you still want to change it, address "Show scroll bars" section of the "Change General preferences on Mac" guide.
User Interface Logs
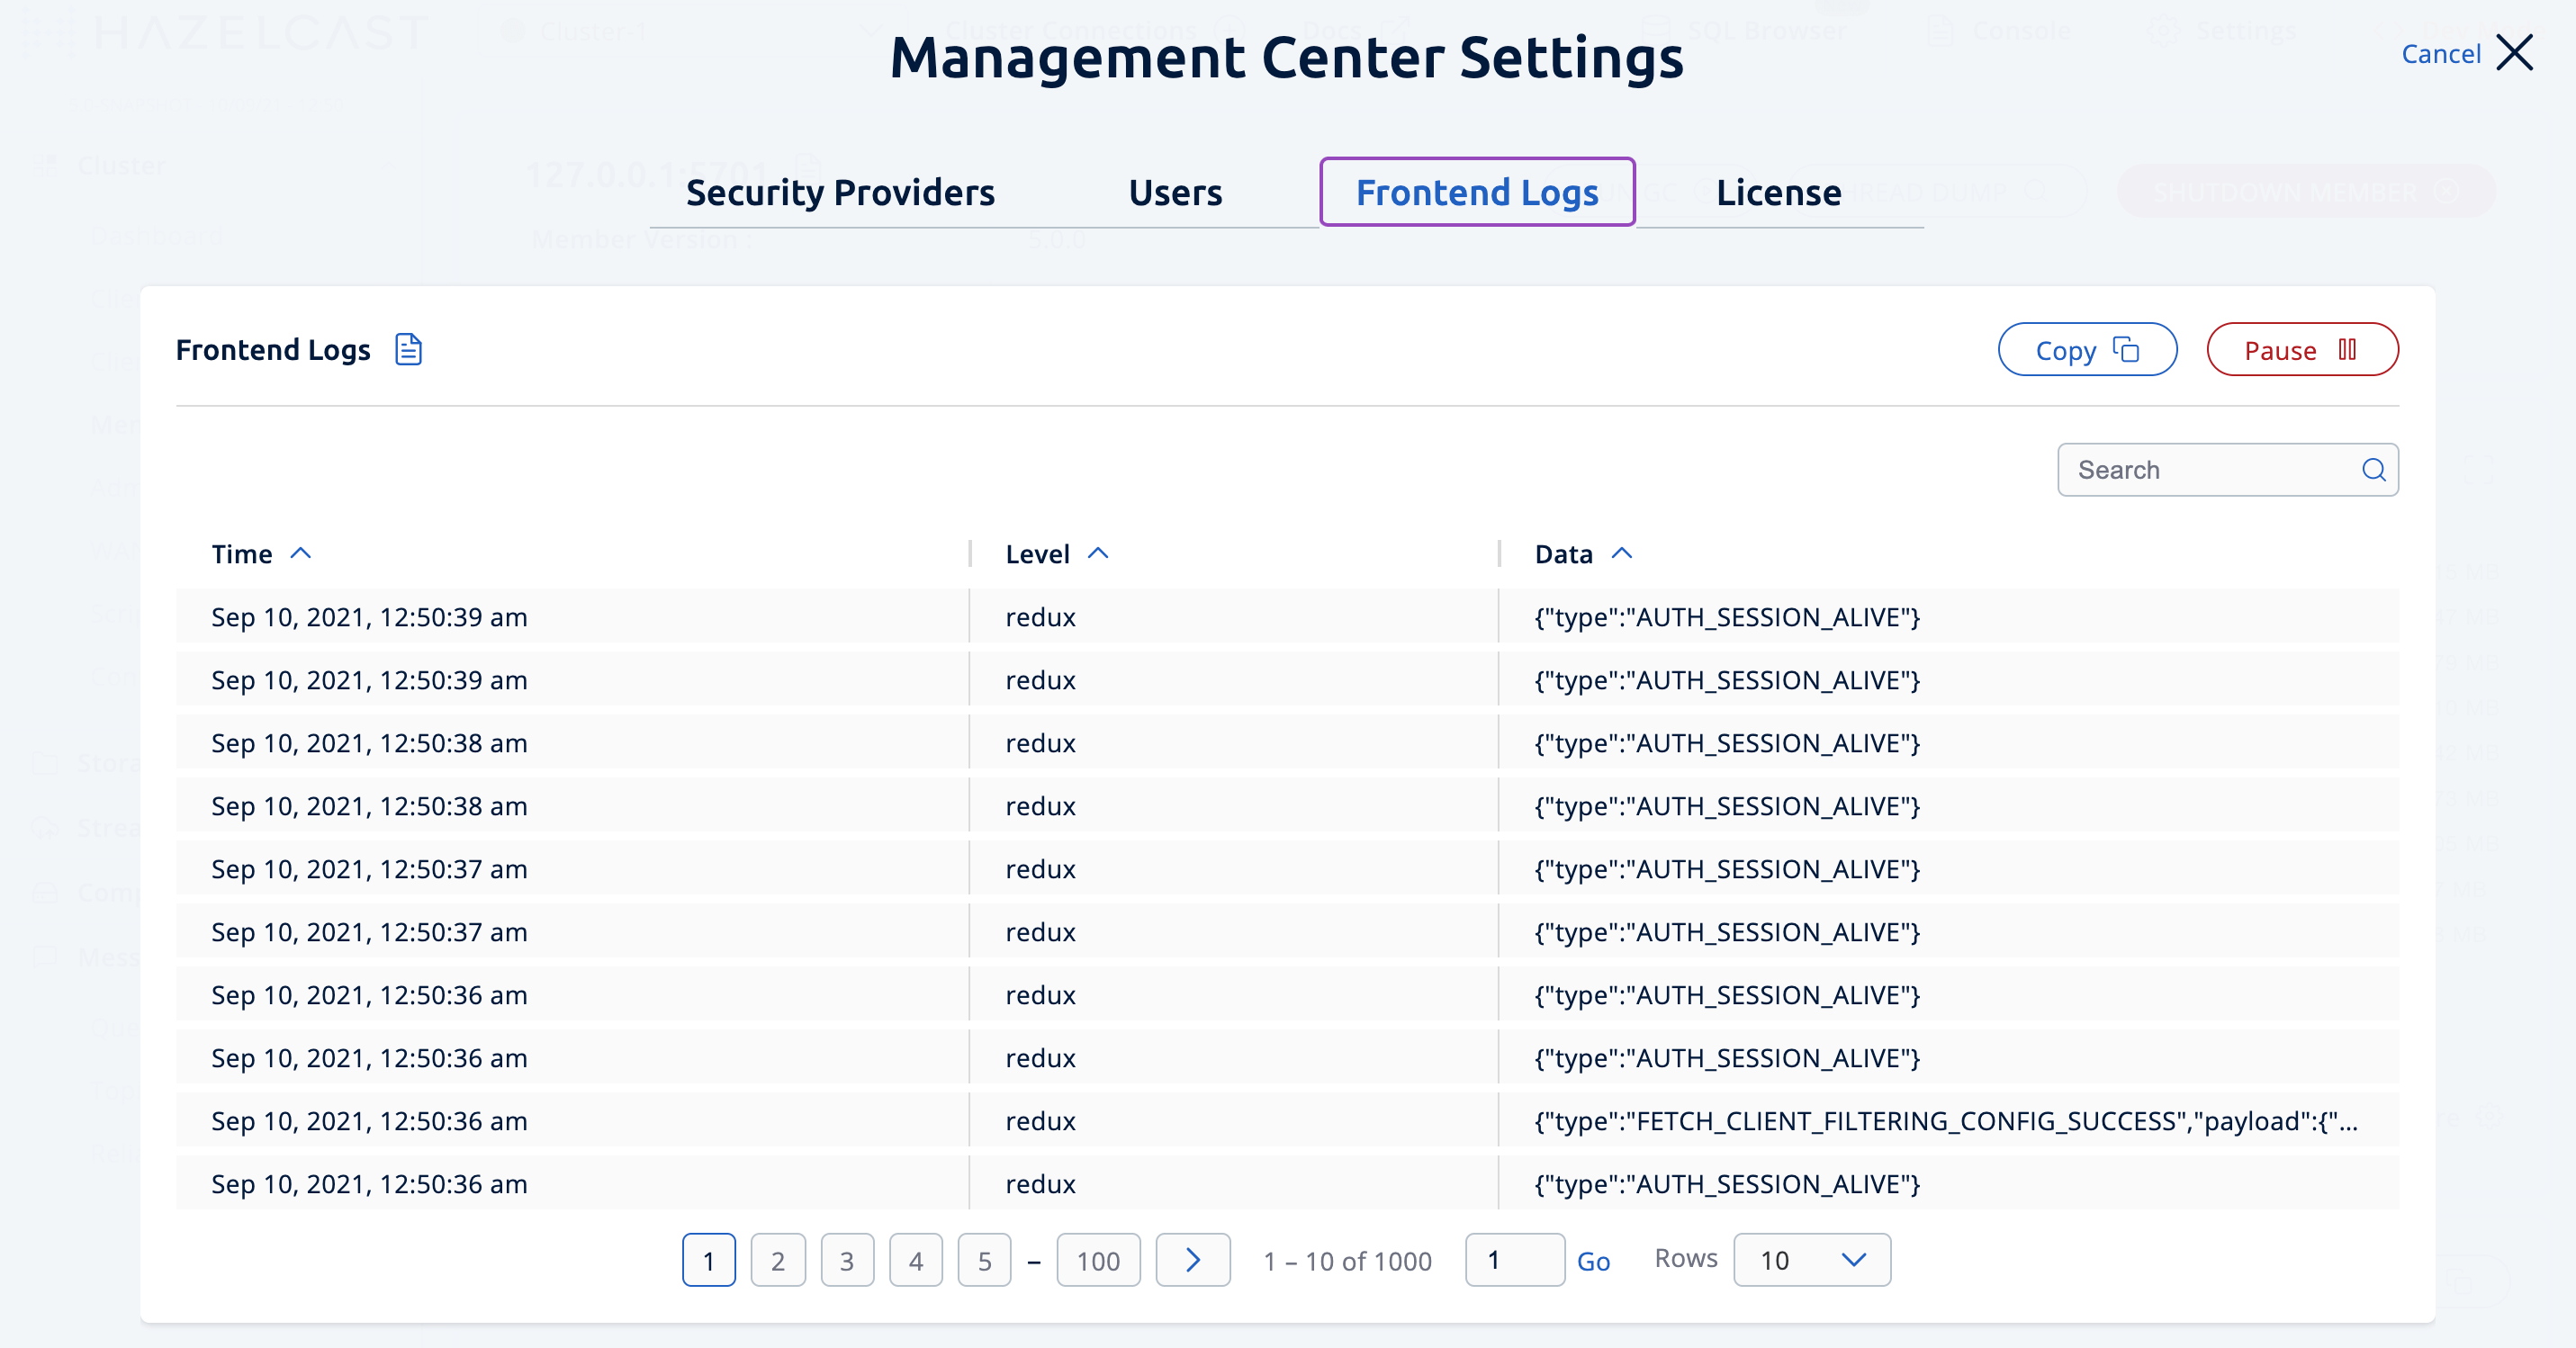
Using the UI Logs page of Settings, you can see the log entries related to the Management Center user interface. This page looks like the following:

This is basically useful to make the troubleshooting easier related to the issues in the user interface. You can see the timestamp and type of each log entry.
You can reorder the entries by their timestamps any types, and also filter them by entering a keyword in the Data field such as "auth", "map" and "session".
You can pause the log flow using the Pause button, copy the log entries to the clipboard using Copy (so that the entries can be examined in detail) and resume the flow using Resume.
| You may only need to share the information in these logs if requested by the Hazelcast support team. |
Experience Timeout
If you experience a timeout when running scripts or SQL queries, you can increase the timeout value
in the hazelcast.mc.cluster.operation.timeout.millis property.

