Hazelcast provides diagnostic logging capabilities that help with troubleshooting and monitoring.
An extended set of diagnostics plugins is provided for both Hazelcast members and clients. A dedicated log file is used to write the diagnostics content, and a rolling file approach is used to prevent taking up too much disk space.
You can switch diagnostic logging on and off at runtime (known as dynamic configuration) without having to restart the cluster.
To prevent logs from running indefinitely, you can also automatically switch diagnostic logging off after a set period by configuring the auto turn-off feature in Management Center.
| Only admin users can configure diagnostic logging settings, and the feature is only available in version 5.6 or later. |
| Diagnostic logging can also be configured via the REST API — for details, see Diagnostics Config API. |
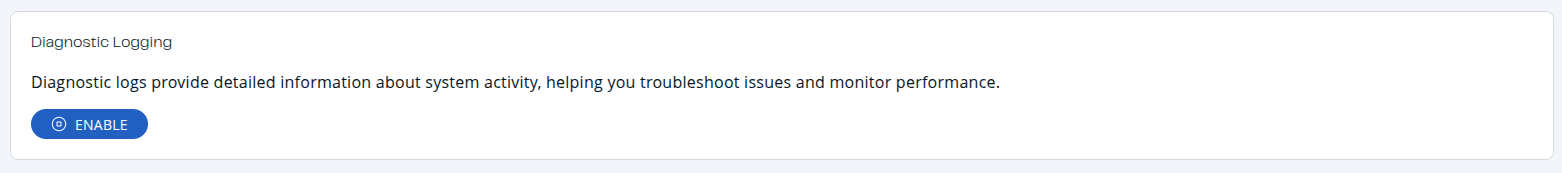
Enable diagnostic logging
To enable diagnostic logging:
-
From the Side Bar, choose Cluster > Administration > Cluster State.
-
Click the
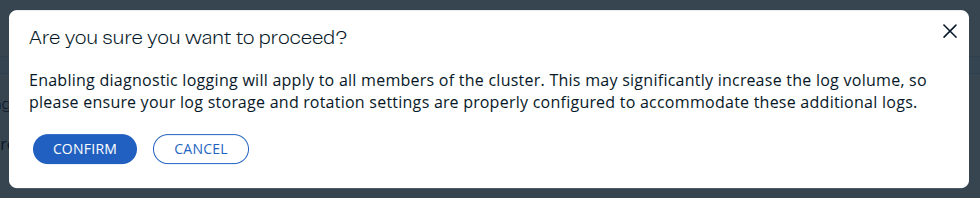
Enablebutton, configure the auto turn-off settings if desired, confirm the action, and wait until the process is finished.
Configure auto turn-off
When enabling diagnostic logging, you can configure an automatic turn-off duration to prevent logs from running indefinitely and having a performance impact on the cluster.
-
Auto turn-off enabled: Select this option to automatically disable diagnostic logging after a specified duration.
-
Duration format: Specify using the format
1d 23h 45m(days, hours, minutes). Note that one month is calculated as 30 days. -
Auto turn-off disabled: If auto turn-off is disabled, diagnostic logging will run indefinitely until manually disabled.
| When diagnostic logging is enabled with auto turn-off, members that join the cluster later will start their own timers from zero. As a result, earlier members may stop diagnostics before the last joiner, leading to a temporary inconsistency. To keep the reported state accurate, Management Center restarts its diagnostics auto turn-off timer from zero whenever a new member joins while diagnostics is enabled. This ensures Management Center shows diagnostics as enabled as long as at least one member is still logging. |
Prerequisites and limitations
-
Admin only: Only admin users can configure diagnostic logging settings.
-
Use STDOUT for diagnostic logs in Kubernetes and Docker: A known limitation prevents dynamic diagnostic logging from being started with file output in Docker and Kubernetes environments. This is due to the default logging directory being read-only. The recommended workaround is to direct diagnostic logs to STDOUT so standard logging systems can collect them, or to preconfigure a writable storage location if file output is required.
-
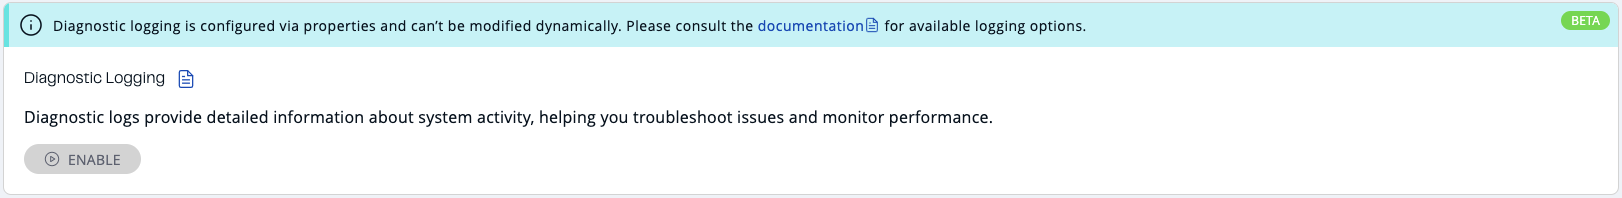
Dynamic configuration: If diagnostic logging is configured in Hazelcast Platform via system properties (known as static configuration), logging cannot be switched on and off dynamically through the Management Center interface and the following message will appear:
Diagnostic logging notifications
To inform you about the status of diagnostic logging, Management Center displays notifications at the top of every page.
When diagnostic logging is enabled
-
A persistent notification banner appears displaying "Diagnostic logging enabled"
-
The banner includes a warning: "This may significantly increase the log volume"
-
Shows the auto turn-off configuration (if enabled)
-
Displays the timestamp when logging was enabled
-
The notification remains visible until diagnostic logging is disabled

When diagnostic logging is disabled
-
A dismissible notification appears showing "Diagnostic logging was disabled at [timestamp]"
-
You can dismiss this notification by clicking the close button
-
Once dismissed, the notification won’t appear again for the same disable event
-
The system remembers your dismissal preference per user and cluster

| Notifications appear only when diagnostic logging is enabled via dynamic configuration. |
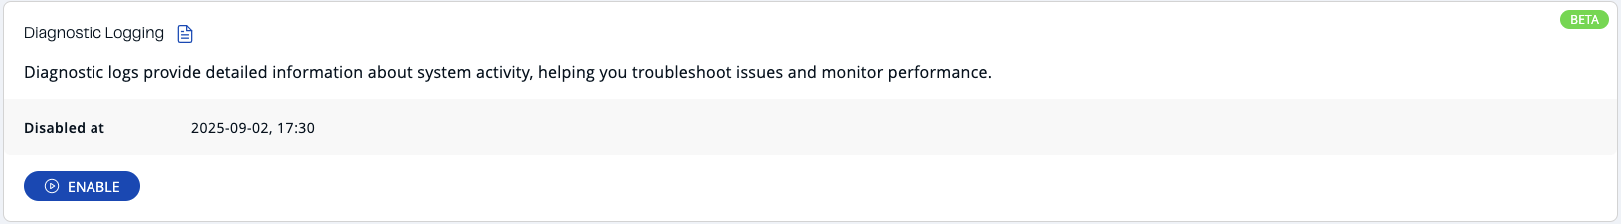
Monitor diagnostic logging status
When diagnostic logging is active, the interface displays:
-
Auto turn-off configuration: Shows the configured automatic turn-off duration
-
Enabled at: Timestamp when diagnostic logging was last enabled
-
Disabled at: Timestamp when diagnostic logging was last disabled (shown when logging is currently disabled)
These timestamps help track the logging activity history and are useful for troubleshooting and audit purposes.
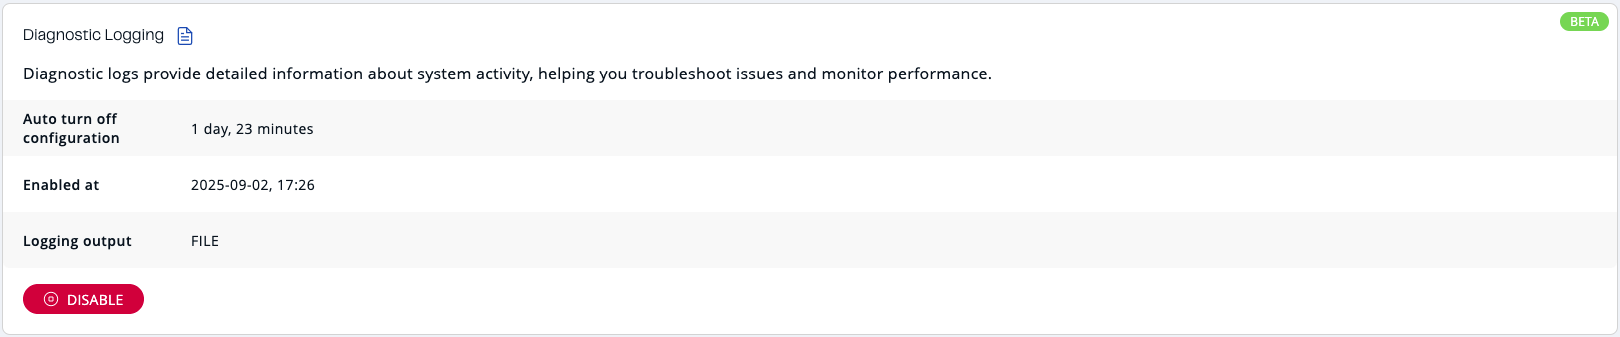
Disable diagnostic logging
To disable diagnostic logging, click the Disable button and wait until the process completes.
If auto turn-off is enabled, diagnostic logging will be disabled automatically when the configured duration expires.
For more information about diagnostic logging configuration and available logging options, see Diagnostic Logging in Hazelcast Platform.