Use the Hazelcast Pipeline API to build an application for modifying machine shop operations based on real time telemetry.
Context
ACME operates thousands of machines, each reporting many datapoints each second. Measurements include things like bit temperature and RPM. Breakage is expensive, both in replacement parts and in downtime. Maintenance schedules can prevent some loss, but we want to go beyond that to monitor operations in real time. If excessive bit temperatures are caught in time, breakage can be averted by immediately reducing the cutting speed.
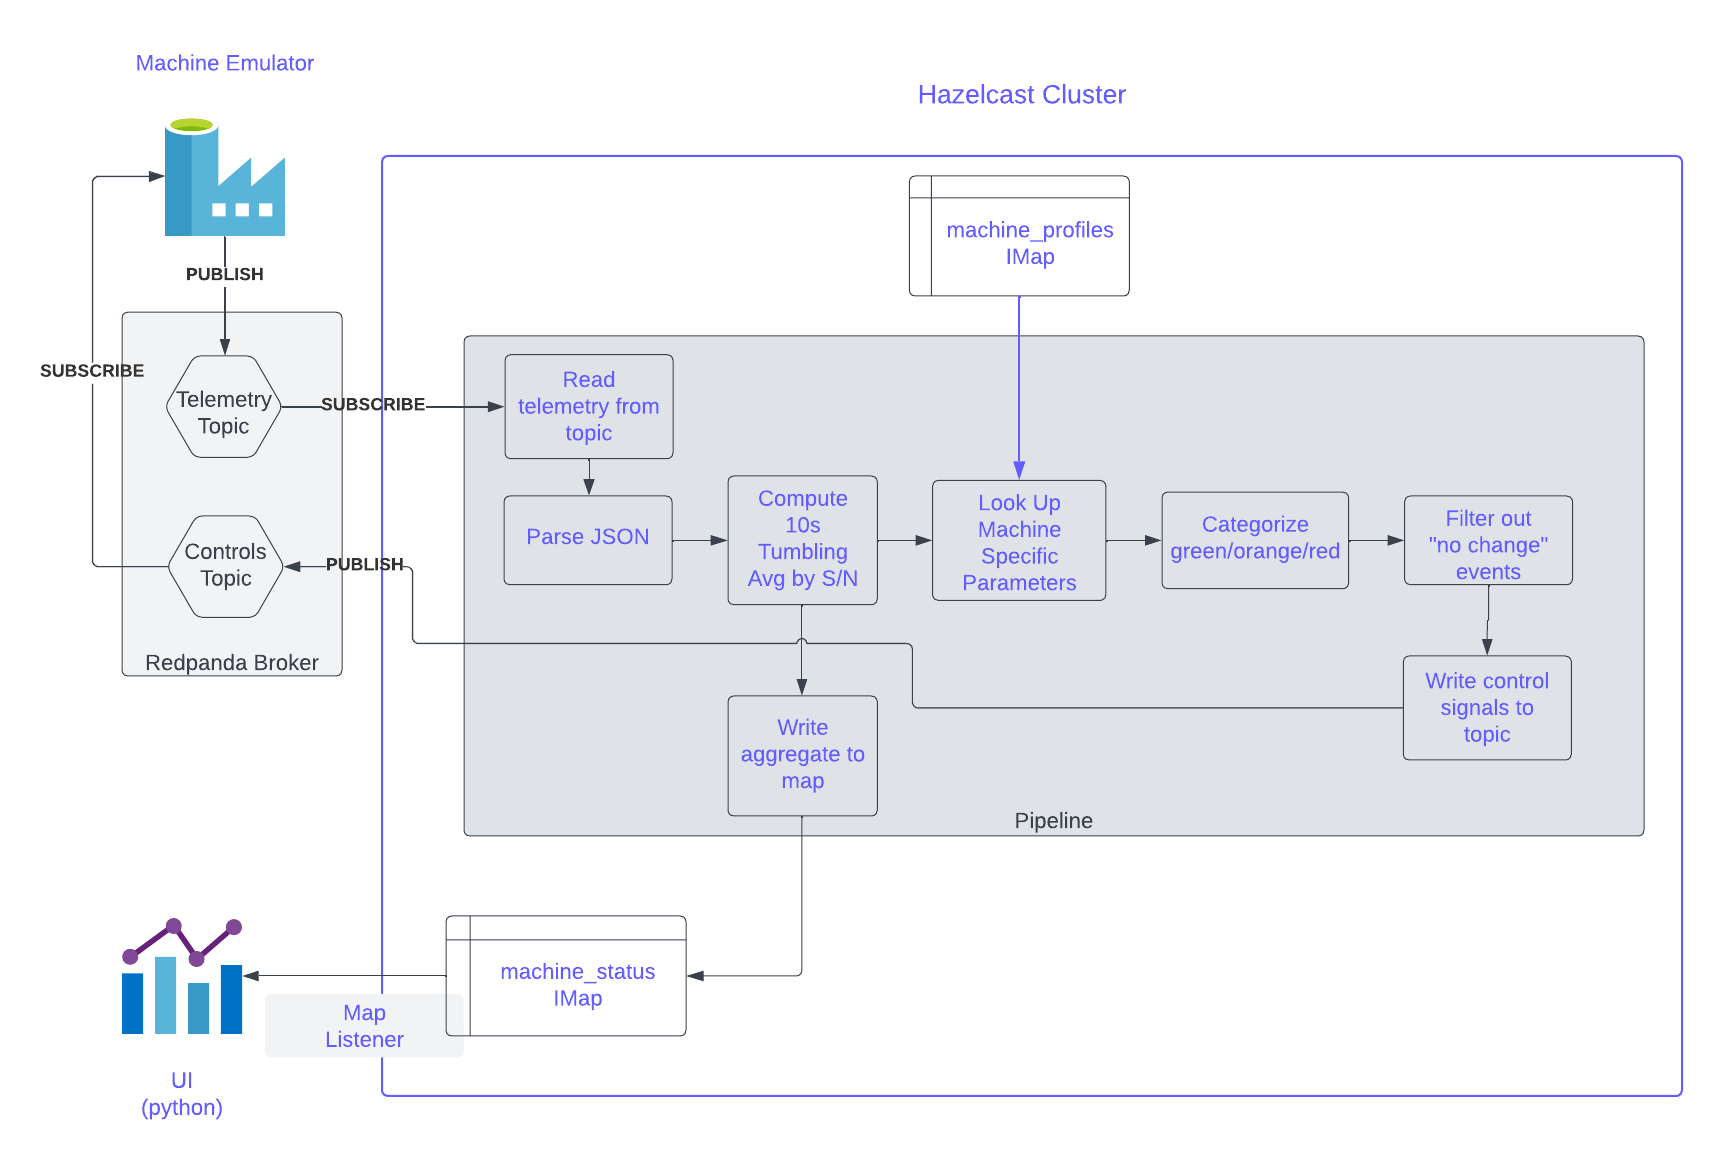
In this lab, we will implement a pipeline which processes telemetry events from a Kafka topic. The pipeline will parse the events and, for each machine, compute a 10s tumbling average of the bit temperature. From there the pipeline will fork. One fork will record the current 10s average to another IMap which will be used for monitoring. In this lab, a python client uses a listener to watch the IMap containing the 10s averages and displays them in real time. The other fork of the pipeline looks up machine specific looks up machine specific limits in the "machine_profiles" map and applies a "green"/"orange"/"red" label to each 10s average. Finally, the pipeline performs de-duplication so that only changes to the "green"/"orange"/"red" status remain and, finally, each status change is published to a topic there the machine emulator will pick it up and adjust the cutting speed accordingly.
A schematic is shown below.
Before You Begin
You will need the following installed on your system:
-
JDK 17 or later
-
Your preferred Java IDE (We recommend IntelliJ IDEA)
Step 1: Validate the Lab Environment
-
Download the repo from https://github.com/hazelcast-guides/stream-processing-fundamentals/
-
Run the following commands to start your lab environment.
mvn install
docker compose up -d
docker compose ps
You should see 7 services up and running. You may also see an eighth service called
refdata_loaderwhich exits after it has loaded data into themachine_profilesmap.Each service is described briefly below.
Service
Description
hz1
A Hazelcast node, 1 of 2. This node has a port mapping so that you can connect to it using CLC at localhost:5701.
hz2
A Hazelcast node, 2 of 2. Will form a cluster with hz1
mc
The Hazelcast Management Center. Accessible at http://localhost:8080.
event_generator
Emulates traffic from a set of machines. Writes to
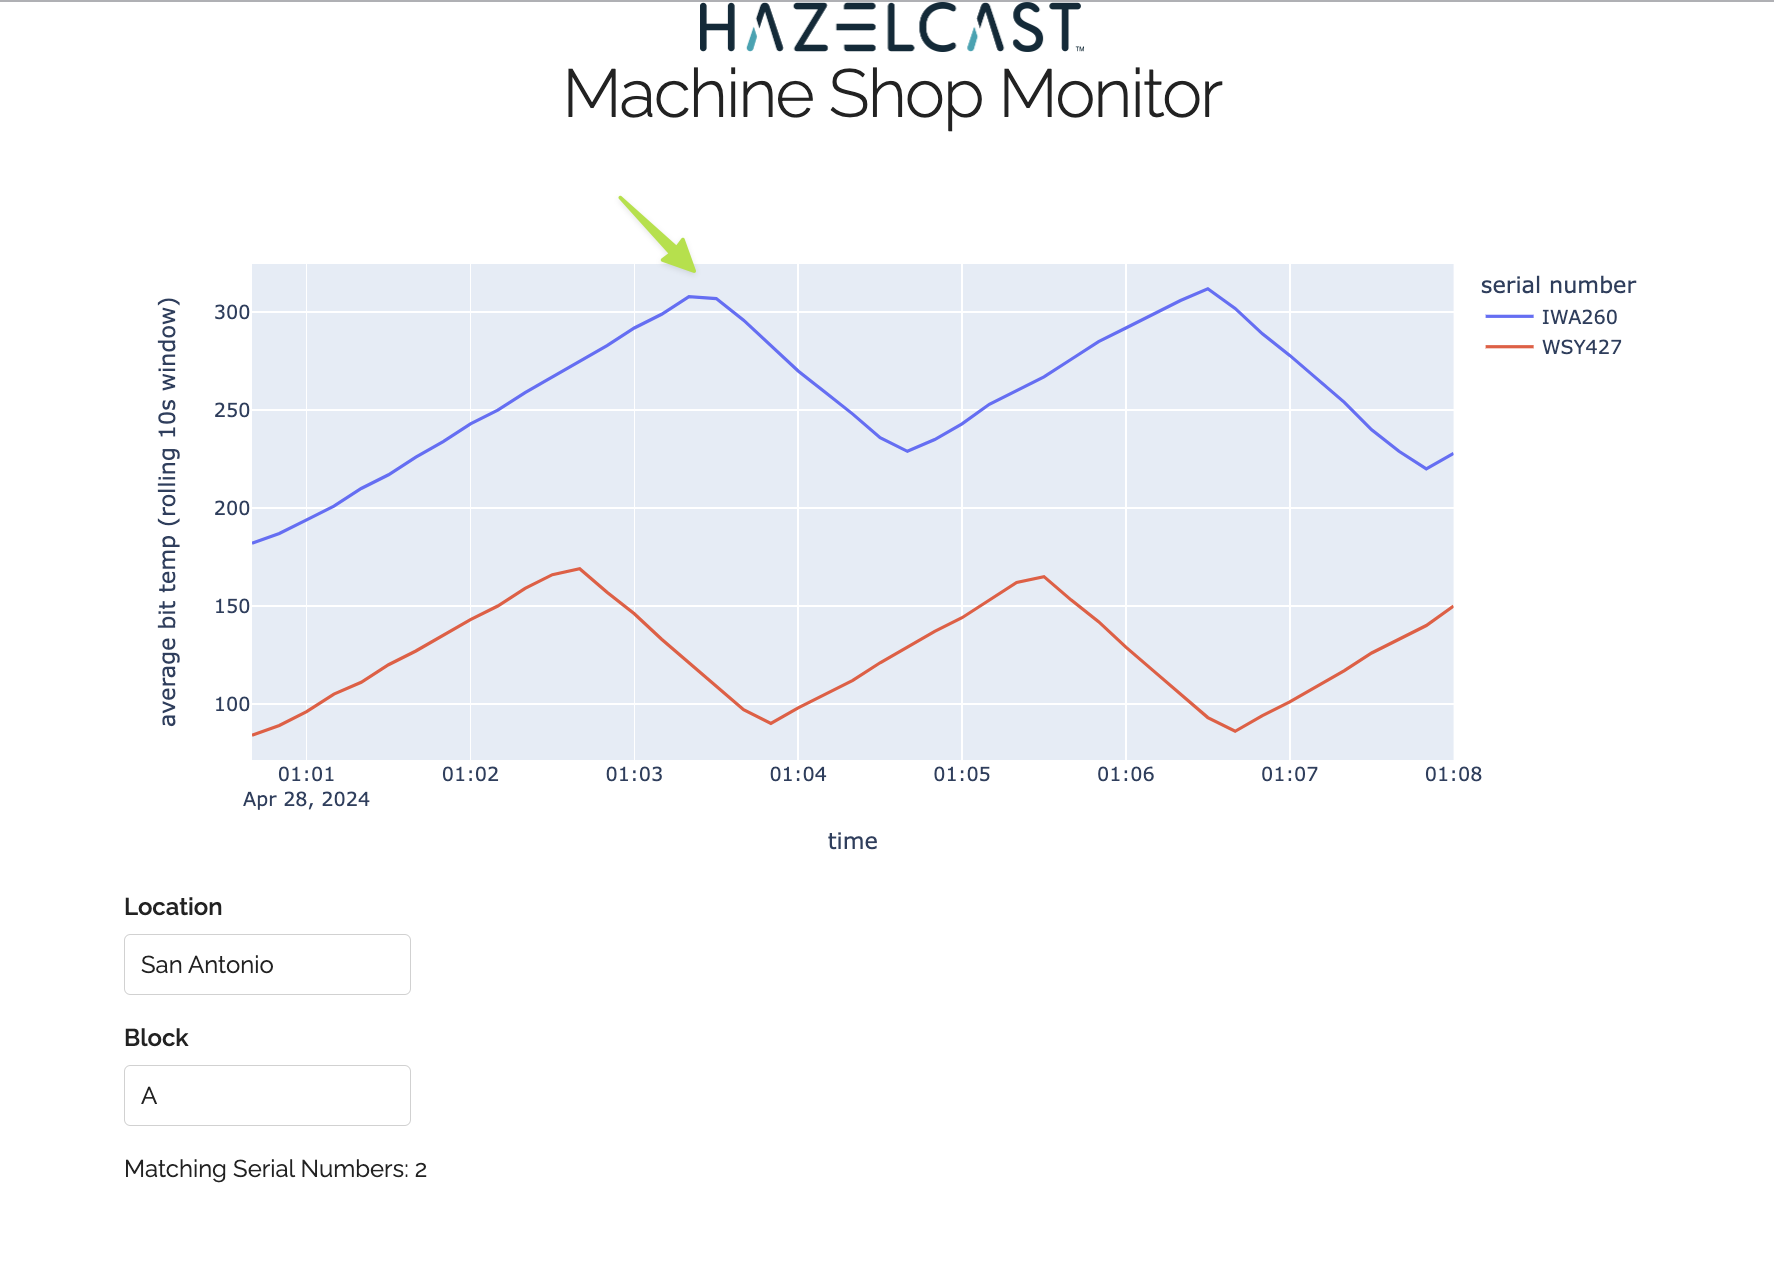
machine_events. Listens tomachine_controls.ui
A Python program that listens to the
machine_eventsmap and displays temperature data graphically. Accessible at http://localhost:8050redpanda
A Kafka-compatible message broker.
kafka-ui
A UI that can be used for viewing events in the Kafka topics used byt his lab. It is accessible at http://localhost:8000
Step 2: Get to Know the Data
-
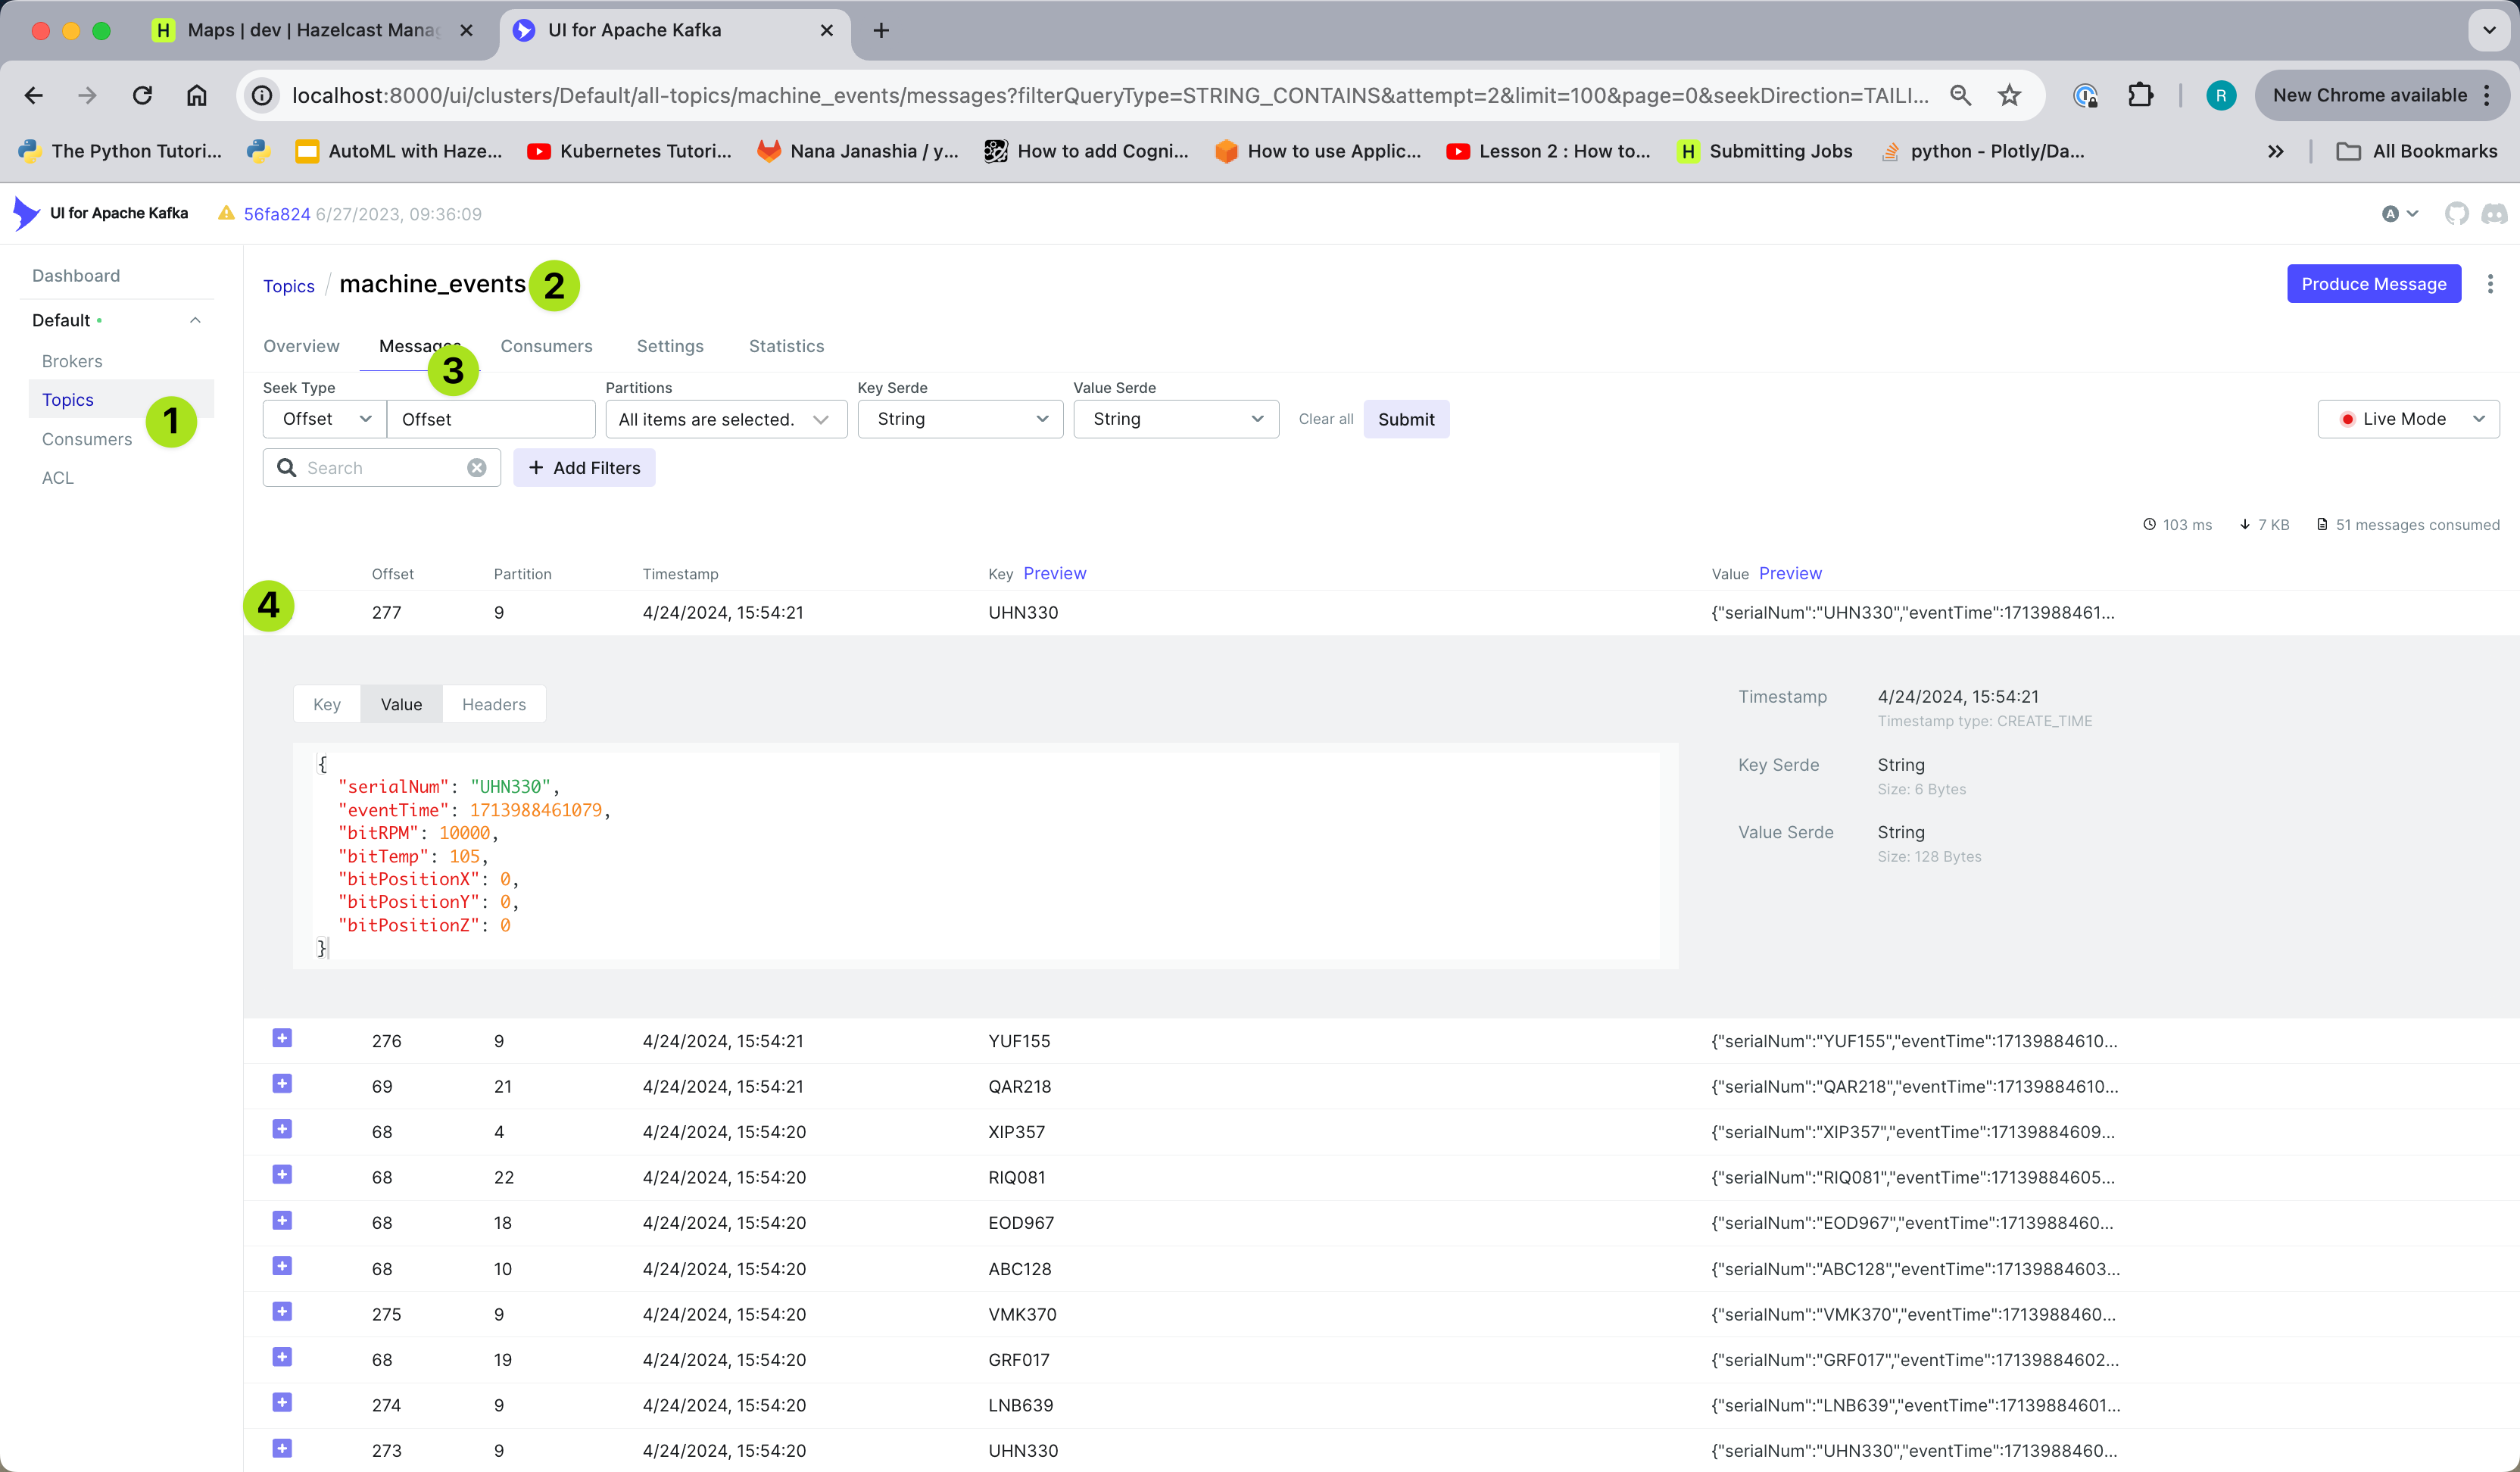
Access the Kafka UI at http://localhost:8000 and observe the events in the "machine_events" topic.
-
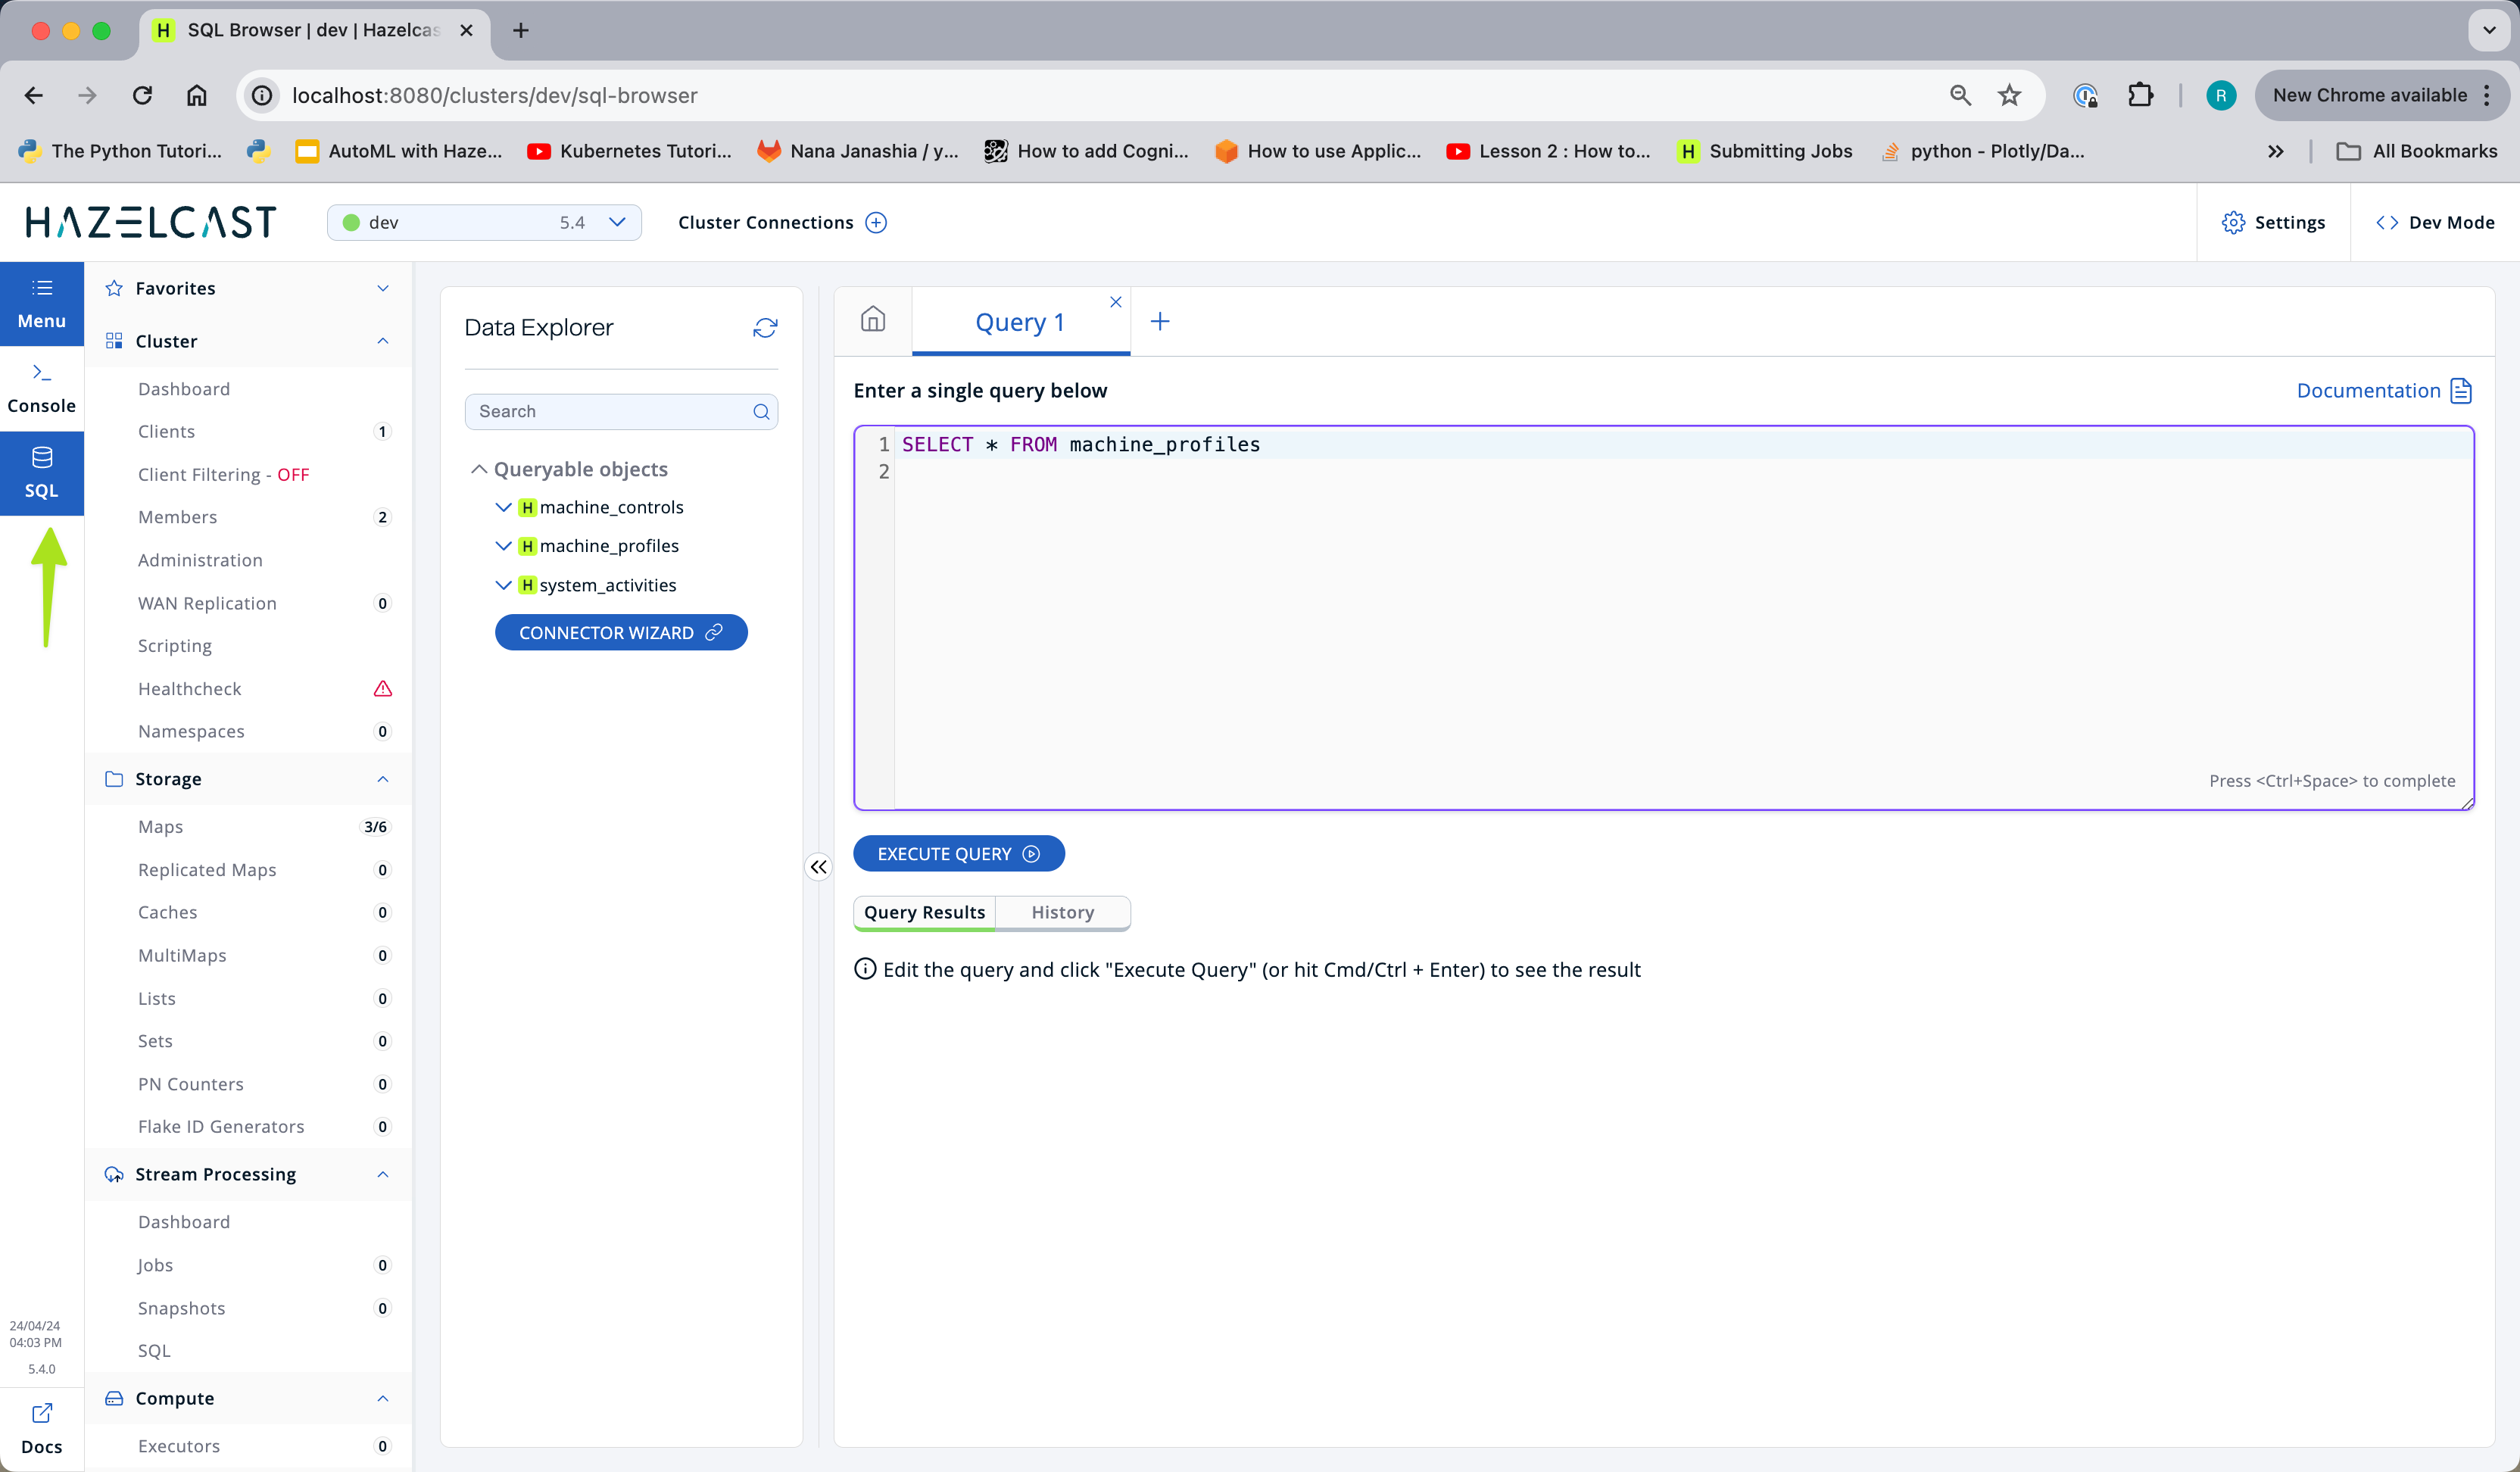
Open up the management center (http://localhost:8080) and select "SQL" from the menu on the left.
-
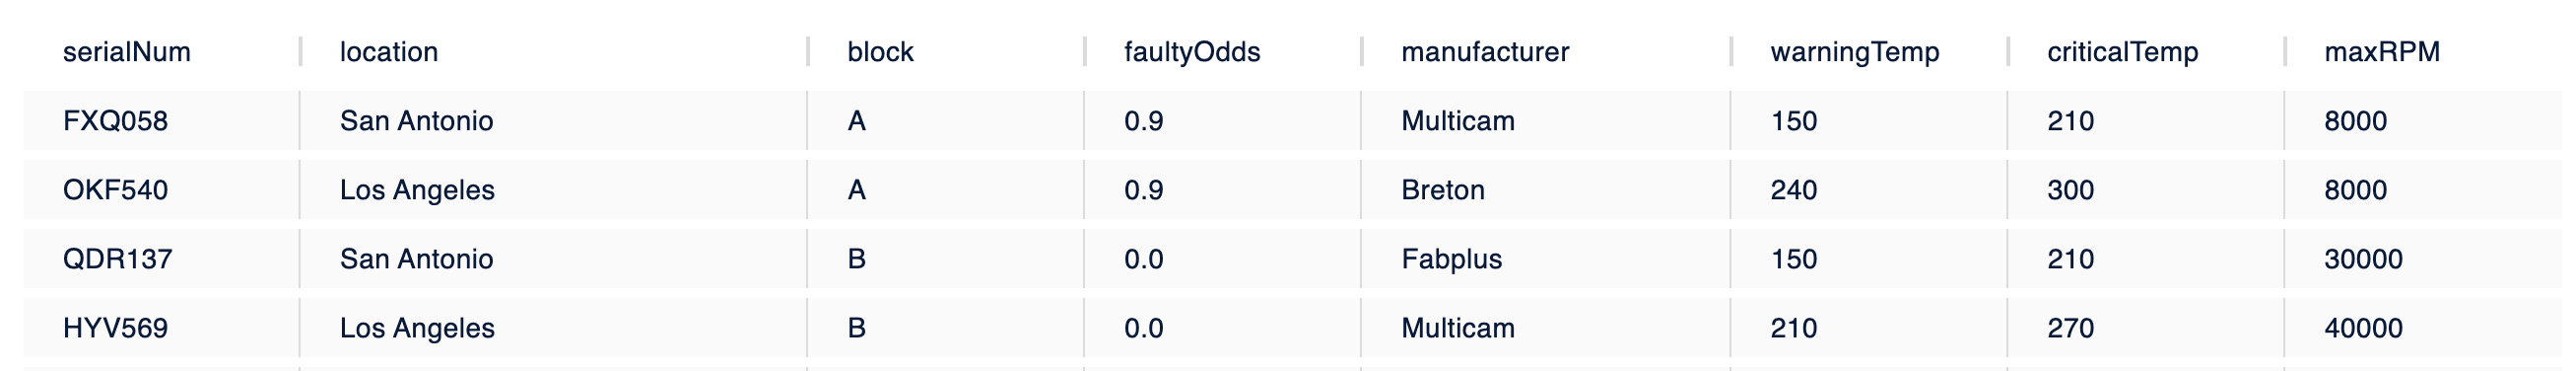
Run
select * from machine_profilesin the Data Explorer.You will see that for each machine there is a serial number, information about the location and the warning and critical temperature limits for that particular machine.
-
In a terminal window, set up the Command Line Client to connect to the Hazelcast instance in Docker. Note that, in the command below, "Docker" is just a nickname for your cluster. The configuration will be stored on your local machine, and you will be able to run commands on the cluster by passing
-c Docker.clc config add Docker cluster.name=dev cluster.address=localhost:5701 -
Validate your CLC configuration by running the same query as above via the CLC.
clc -c Docker sql -q "select * from machine_profiles"
| From this point forward, you can use either Management Center or CLC to run SQL queries and monitor jobs. |
Step 3: Learn About Data Formats
GenericRecord
It is a best practice to avoid using POJOs in Pipelines if that POJO will be stored in a Hazelcast map. It can cause class loading problems.
| When using Compact or Portable serialization, if a POJO is accessed in server-side code, it will be be deserialized as a GenericRecord if the POJO class is not on the server’s class path. Accordingly, server side code must be written to handle either a GenericRecord or a POJO depending on whether the POJO class is present. |
In this lab, you will be working with MachineProfile objects and MachineStatusSummary, both of which are defined in common/src/main/java. However, those classes are not deployed with your job, so you will need to access them using GenericRecord. An example of GenericRecord usage is shown below.
GenericRecord machineProfile;
short bitTemperature = machineProfile.getInt16("warningTemp");
For more information on GenericRecord and accessing domain objects without domain classes see https://docs.hazelcast.com/hazelcast/latest/clusters/accessing-domain-objects.
It is OK to use the MachineStatusEvent class directly on the server side because, unlike the 2 classes mentioned above, it is never written into an IMap
|
Tuples
As data proceeds through your pipeline its shape changes. For example, you may look up the warning and critical temperatures for a particular machine and send them along with the original event to the next stage in the pipeline. There is no need to create special container classes for situations like this, you can use Tuples instead. Here is an example.
// create a 3-tuple that consists of the serial number and bit temperature from the event
// and the warning temperature from the machine profile

GenericRecord p;
MachineStatusEvent e;

Tuple3<String,Short,Short> newEvent =
        Tuple3.tuple3(e.getSerialNum(), e.getBitTemp(), p.getShort("warningTemp"));

// now, if we want to access fields from the 3-tuple, we use f0(), f1() and f2()
short bitTemp = newEvent.f1();
Step 4: Deploy Your First Job
-
In your IDE, navigate to the monitoring-pipeline project. Open up the hazelcast.platform.labs.machineshop.TemperatureMonitorPipeline class and review the code there.
The main method, shown below, is boilerplate that helps with deploying the job to a cluster. You do not need to change this.
public static void main(String []args){
        if (args.length != 3){
            throw new RuntimeException("Expected 3 arguments (KAFKA_BOOTSTRAP_SERVERS, MACHINE_EVENTS_TOPIC, MACHINE_CONTROLS_TOPIC) but found " + args.length);
        }

        Properties props = new Properties();
        props.setProperty("bootstrap.servers", args[0]);
        props.setProperty("key.serializer", "org.apache.kafka.common.serialization.StringSerializer");
        props.setProperty("value.serializer", "org.apache.kafka.common.serialization.StringSerializer");
        props.setProperty("key.deserializer", "org.apache.kafka.common.serialization.StringDeserializer");
        props.setProperty("value.deserializer", "org.apache.kafka.common.serialization.StringDeserializer");
        props.setProperty("auto.offset.reset", "latest");

        Pipeline pipeline = createPipeline(props, args[1], args[2]);
        /*
         * We need to preserve order in this pipeline because of the change detection step
         */
        pipeline.setPreserveOrder(true);

        JobConfig jobConfig = new JobConfig();
        jobConfig.setName("Temperature Monitor");
        HazelcastInstance hz = Hazelcast.bootstrappedInstance();
        hz.getJet().newJob(pipeline, jobConfig);
}
You will do all of your work in the
createPipelinemethod of this job. It always starts with creating aPipelineobject. You then build up the Pipeline by adding stages to it.public static Pipeline createPipeline(Properties kafkaConnectionProps, String telemetryTopicName, String controlsTopicName){ Pipeline pipeline = Pipeline.create(); // add your stages here return pipeline; }We use the Shade plugin to bundle all project dependencies, other than Hazelcast, into a single jar. The Hazelcast classes should not be included because they are already on the server. Also, code with com.hazelcastpackage names cannot be deployed to the server.Currently, the
createPipelinemethod contains only a source (reading from themachine_eventsmap) and a sink, which simply logs the events to the console. This can be useful during debugging. In the next step, you’ll make a small change to the Pipeline and walk through a typical code/test cycle. -
If you wish, make a small change to the output format in the writeTo statement just so we can walk through building and deploying a pipeline. After you’ve made the change, you can deploy the pipeline using the commands below.
# build and package the pipeline
cd monitoring-pipeline
mvn package
cd ..

# submit the job
clc -c Docker job submit  --class=hazelcast.platform.labs.machineshop.TemperatureMonitorPipeline monitoring-pipeline/target/monitoring-pipeline-1.0-SNAPSHOT.jar redpanda:9092 machine_events machine_controls

# look for the logging statements in the Hazelcast logs
docker compose logs --follow hz1 hz2
Ctrl-C
You should see something like this in the Hazelcast cluster member logs:
stream-processing-fundamentals-hz1-1  | 2024-04-25 17:57:10,410 [ INFO] [hz.competent_sanderson.jet.blocking.thread-4] [c.h.j.i.c.WriteLoggerP]: [172.26.0.5]:5701 [dev] [5.4.0] [Temperature Monitor/loggerSink#0] Received event for EBJ194
stream-processing-fundamentals-hz1-1  | 2024-04-25 17:57:10,438 [ INFO] [hz.competent_sanderson.jet.blocking.thread-4] [c.h.j.i.c.WriteLoggerP]: [172.26.0.5]:5701 [dev] [5.4.0] [Temperature Monitor/loggerSink#0] Received event for BWL505
stream-processing-fundamentals-hz2-1  | 2024-04-25 17:57:10,472 [ INFO] [hz.jolly_moser.jet.blocking.thread-4] [c.h.j.i.c.WriteLoggerP]: [172.26.0.2]:5701 [dev] [5.4.0] [Temperature Monitor/loggerSink#1] Received event for FKR936
stream-processing-fundamentals-hz2-1 | 2024-04-25 17:57:10,569 [ INFO] [hz.jolly_moser.jet.blocking.thread-4] [c.h.j.i.c.WriteLoggerP]: [172.26.0.2]:5701 [dev] [5.4.0] [Temperature Monitor/loggerSink#1] Received event for GBQ070-
When you are done, you can cancel the job using the CLC. The Hazelcast cluster and Kafka broker will remain up and events will continue to be written to the
machine_eventstopic.% clc -c Docker job list Job ID | Name | Status | Submitted | Completed 0b99-d896-1c00-0002 | Temperature Monitor | RUNNING | 2024-04-25 13:56:34 | - OK Returned 1 row(s). % clc -c docker job cancel 0b99-d896-1c00-0002 OK [1/2] Connected to the cluster. OK [2/2] Started cancellation of '0b99-d896-1c00-0002'. -
Pat yourself on the back! You’ve deployed your first pipeline.
Step 5: Finish the Pipeline
Continue building the pipeline following the instructions in TemperatureMonitorPipeline.java
You may want to deploy and cancel the job multiple times while you are building the pipeline. When you are done, look at the UI. You should be able to tell that your job is now controlling the machines.
You can also look at the event_generator logs and see it responding to
control messages …
docker compose logs --follow event_generator
stream-processing-fundamentals-event_generator-1  | WSY427 went GREEN, resuming normal speed
stream-processing-fundamentals-event_generator-1  | IWA260 went RED, reducing speed
stream-processing-fundamentals-event_generator-1  | XTE831 went GREEN, resuming normal speed
stream-processing-fundamentals-event_generator-1  | ROB293 went GREEN, resuming normal speed
stream-processing-fundamentals-event_generator-1  | IWA260 went GREEN, resuming normal speed
stream-processing-fundamentals-event_generator-1  | WSY427 went RED, reducing speed
stream-processing-fundamentals-event_generator-1  | XTE831 went RED, reducing speed
If it did not work right away, there are a couple of things you can inspect to help you diagnose and correct the problem.
-
use the Kafka UI to Browse the "machine_control" Kafka topic to verify that control messages are being sent by your Pipeline.
-
Using Management Center or CLC to query the
machine_statusmap. This map drives the UI and should be receiving updates regularly.
| If at any point you get stuck, you can refer to the solution which you will find in the hazelcast.platform.labs.machineshop.solutions package. |