Deploy a Java application that updates a trade monitoring dashboard in real-time.
Context
Trading exchanges, platforms, and brokers rely on real-time data.
-
Real-time market data allows customers to execute trades in response to the smallest changes in stock prices.
-
Real-time trade data allows internal teams to analyze and monitor the trading activities of their customers.
In this tutorial, you’ll create a dashboard for monitoring customer’s trading activities. You’ll learn how a trade monitoring application generates, ingests, aggregates, and enriches streaming data to update the dashboard in real-time.
Architecture
The trade monitoring application runs locally. Application components create a streaming and static data source, submit stream processing jobs to the Cloud cluster, and serve data to the trade monitor dashboard.
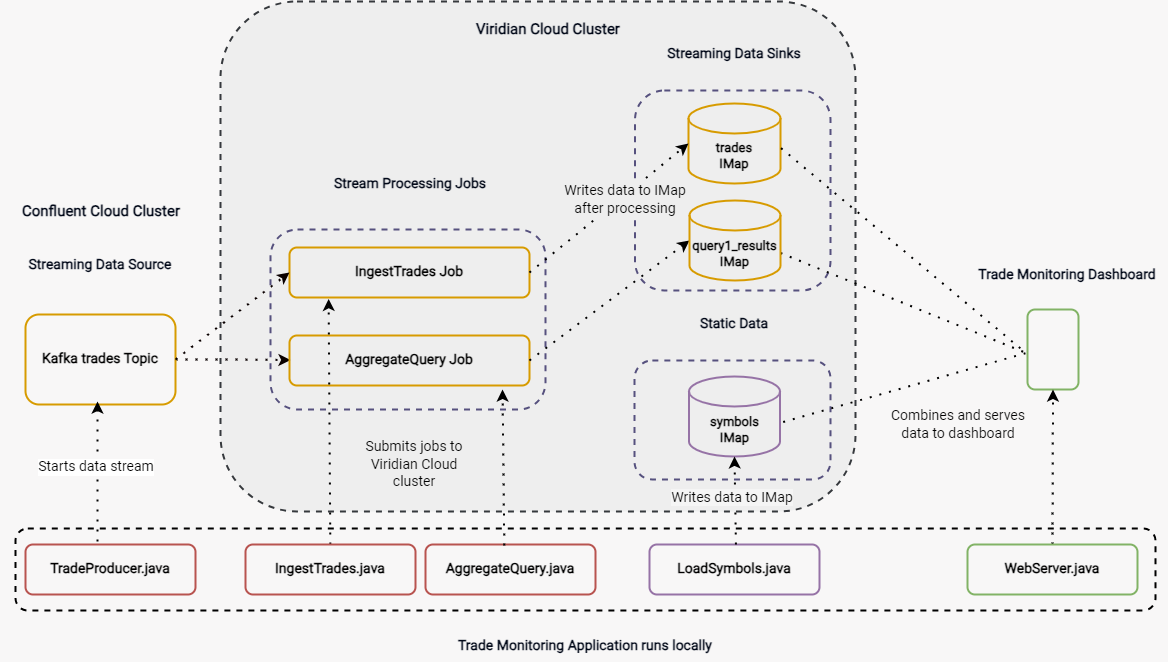
Only the streaming data source is hosted on a Confluent Cloud Kafka cluster. All other trades data is hosted and processed on a Cloud Standard cluster.
Components
-
TradeProducer.java: Sets up the streaming data source. This class sends a simulated feed of trades data to a Kafka topic on the Cloud Confluence cluster. -
LoadSymbols.java: Creates thesymbolsmap on the Cloud cluster that contains static stock information, which is used to enrich the streaming data after it is processed. -
IngestTrades.java: Submits theingestTradesjob to the Cloud cluster. TheingestTradesjob creates a data pipeline that processes the stream of trade messages from the Kafka topic and writes them to thetradesmap (streaming data sink). -
AggregateQuery.java: Submits theAggregateQueryjob, which runs in parallel with theingestTradesjob on the Cloud cluster. TheAggregateQueryjob performs an aggregation on the trades data, grouping trades by stock symbol and keeping a running total of the quantity and values of trades. This data is written to thequery1_Resultsmap. -
WebServer.java: Combines data from thetrades,symbols, andquery1_Resultsmap and serves it to the trade monitor dashboard.
Before you Begin
You need the following:
-
A Cloud Standard cluster. You can use either a development or production cluster.
-
JDK 17 or later installed and set up as the
JAVA_HOMEenvironment variable -
A basic understanding of Kafka.
Step 1. Clone the Sample Project
All the code for the trade monitoring application and dashboard is available on Github. To get started, download the code.
git clone https://github.com/hazelcast-guides/serverless-trade-monitor-dashboard.gitgit clone [email protected]:hazelcast-guides/serverless-trade-monitor-dashboard.gitStep 2. Set Up the Project Files
The sample project uses a Java client to connect to your Cloud Standard cluster. To allow this connection, download the TLS certificate files from the cluster and update the client configuration.
-
Sign into the Cloud console and select your cluster.
-
Next to Connect Client, select any client and then select the Advanced Setup tab.
-
Download the keystore file. Keep the Advanced Setup tab open, you’ll need it in later steps.
-
Extract the files and copy both
client.keystoreandclient.truststoreinto the following directories of your cloned project:-
realtime-trade-monitor/trade-queries/src/main/resources -
realtime-trade-monitor/webapp/src/main/resources
-
-
In the same directories, update the
hazelcast-client.ymlfiles with your cluster connection credentials. You’ll find these details on the Advanced Setup tab.hazelcast-client: cluster-name: <YOUR CLUSTER ID> instance-name: query-client network: ssl: enabled: true properties: protocol: TLSv1.2 trustStore: <PATH>/serverless-trade-monitor-dashboard/realtime-trade-monitor/<DIRECTORY NAME>/src/main/resources/client.truststore trustStorePassword: <YOUR TRUSTSTORE PASSWORD> trustStoreType: jks keyStore: <PATH>/serverless-trade-monitor-dashboard/realtime-trade-monitor/<DIRECTORY NAME>/src/main/resources/client.keystore keyStorePassword: <YOUR KEYSTORE PASSWORD> keyStoreType: jks hazelcast-cloud: discovery-token: <YOUR DISCOVERY TOKEN> enabled: true properties: hazelcast.client.cloud.url: https://api.cloud.hazelcast.comIf necessary, update the absolute paths to the client.keystoreandclient.truststorefiles to match your directory structure.
Step 3. Set Up Your Confluent Cloud Kafka Cluster
To generate a streaming data source for the trade monitor dashboard, you need to create a Kafka topic on a Confluent cluster. The easiest way to do this is to use a free Confluent Cloud cluster.
-
Create a Confluent Cloud account if you don’t have one already.
-
Select the same cloud provider as your Cloud cluster and the region that’s closest to the cluster. For example, AWS Oregon (us-west-2).
-
Skip payment and launch the cluster.
-
Select the name of your cluster in the breadcrumbs at the top of the page.

Next, create your Kafka topic.
-
Click Topics > Create Topic.
-
Enter trades in the Topic name box and 4 in the Partitions box.
-
Click Create with defaults.
-
Click Clients and select Java.
-
Click Create Kafka cluster API key. Enter the Cluster ID of your Cloud cluster into the Description box. This helps you remember which API key this Cloud cluster is using.
-
Copy the code from your configuration snippet from the top to
acks=all. You won’t use the Schema Registry in this tutorial.
Step 4. Add the Connection Details of the Confluent Cloud Cluster
To allow the Java client to access the trades topic, add the connection details of the Confluent Cloud cluster to the client configuration.
-
Paste the connection details that you copied from Confluent Cloud into the following files replacing the placeholder content:
-
realtime-trade-monitor/trade-queries/src/main/resources/kafka.properties -
realtime-trade-monitor/trade-producer/src/main/resources/kafka.propertiesFor example:
# Required connection configs for Kafka producer, consumer, and admin bootstrap.servers=<YOUR BOOTSTRAP SERVER> security.protocol=SASL_SSL sasl.jaas.config=org.apache.kafka.common.security.plain.PlainLoginModule required username='<YOUR API KEY>' password='<YOUR API SECRET>'; sasl.mechanism=PLAIN # Required for correctness in Apache Kafka clients prior to 2.6 client.dns.lookup=use_all_dns_ips # Best practice for higher availability in Apache Kafka clients prior to 3.0 session.timeout.ms=45000 # Best practice for Kafka producer to prevent data loss acks=all -
-
Remove the following lines from both files:
  # Best practice for higher availability in Apache Kafka clients prior to 3.0
  session.timeout.ms=45000
Step 5. Build Your Project
-
From the command prompt, change into the
realtime-trade-monitor/directory. -
Execute the following command:
mvn clean package
Step 6. Create the Data Sources
In this step, you’ll deploy application components to create the static and streaming data sources.
-
Load the static stock information onto your Cloud cluster:
java -jar trade-queries/target/trade-queries-5.0.jar load-symbolsResult
The Java client connects to your cluster and creates the
symbolsmap with 3170 entries, using the code in theLoadSymbolsclass.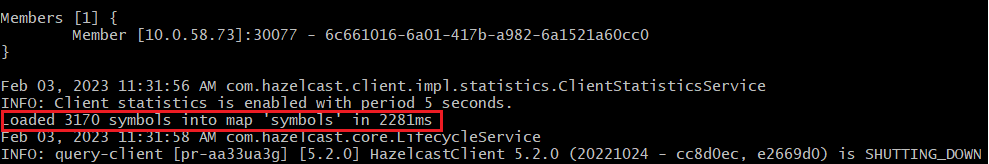
You can check the stock data on your Cloud cluster using SQL.
-
Go back to the cluster console.
-
Select SQL in the left navigation to open the SQL Browser.
-
Create a SQL connection to the new
symbolsmap.CREATE MAPPING symbols TYPE IMap OPTIONS ('keyFormat'='varchar','valueFormat'='varchar'); -
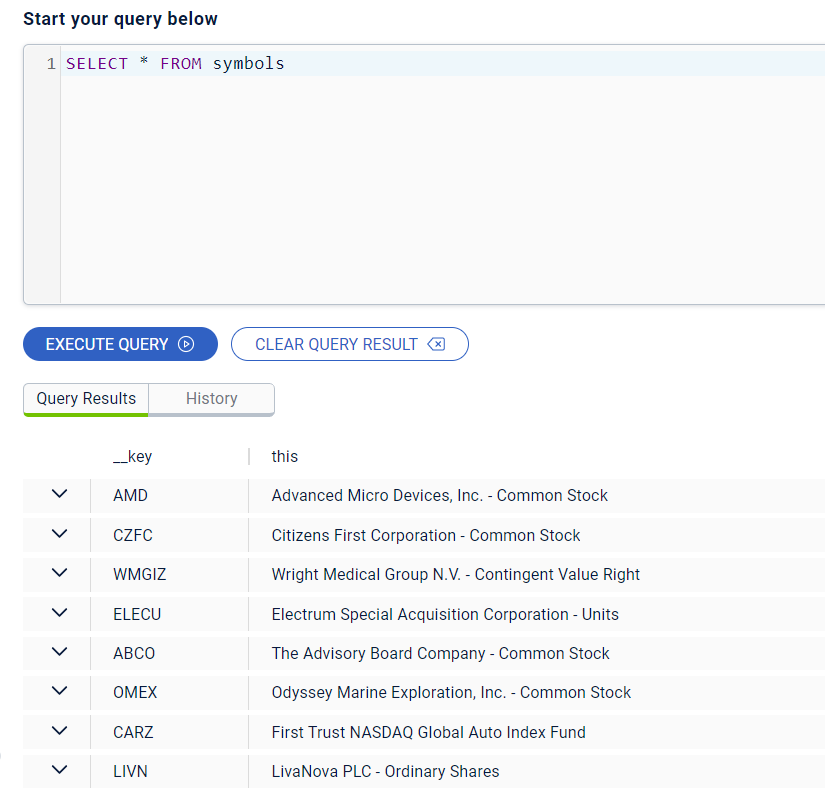
Use the
SELECTstatement to query all data in the map.SELECT * FROM symbols;Result
Your query returns the following data:
-
Close the SQL Browser.
Next, start the Kafka producer. Execute the following command replacing the placeholders:
-
$BOOTSTRAP_SERVER: The address of your Confluent bootstrap server.
-
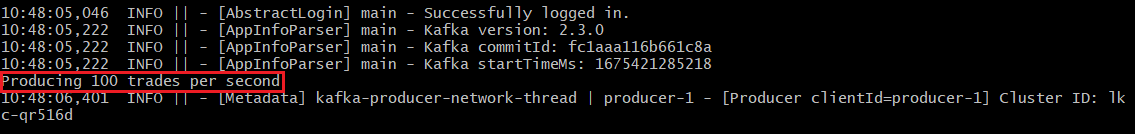
$TRADES_PER_SECOND: The number of trades that you want your data source to produce every second, e.g. 100.
java -jar trade-producer/target/trade-producer-5.0.jar $BOOTSTRAP_SERVER $TRADES_PER_SECONDResult
The trades Kafka topic starts to produce a stream of trade messages at the required interval.
| Keep this terminal window open until you complete the final step of the tutorial. |
Step 7. Process the Streaming Data
In this step, you’ll submit the IngestTrades and AggregateQuery stream processing jobs to your Cloud cluster. You’ll also check that both jobs are running.
-
In a new terminal window, change into the
realtime-trade-monitor/directory. -
Execute the following command to submit and start the
IngestTradesjob:java -jar trade-queries/target/trade-queries-5.0.jar ingest-trades $BOOTSTRAP_SERVERResult
The Java client connects to the cluster and quickly disconnects and shuts down. Continue to the next step.
-
Submit and start the
AggregateTradesjob:java -jar trade-queries/target/trade-queries-5.0.jar aggregate-query $BOOTSTRAP_SERVERResult
Again, the Java client connects to the cluster and quickly disconnects and shuts down. Continue to the next step.
-
Go back to the cluster console and click Management Center.
-
Go to Streaming > Jobs to view the status of both jobs.
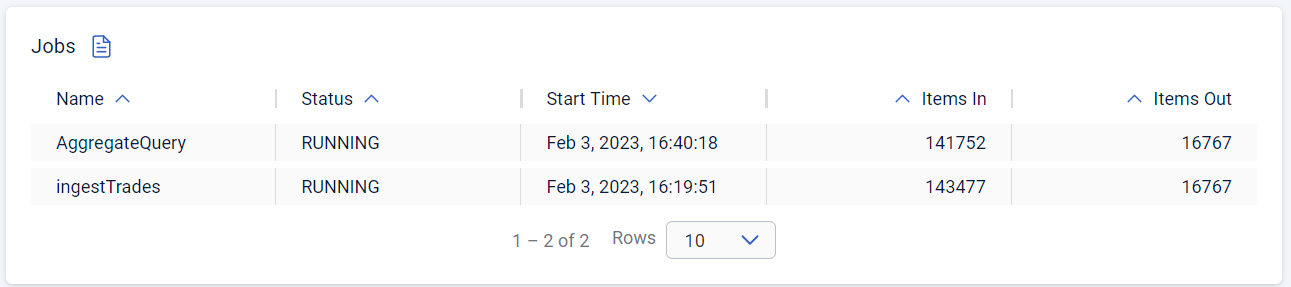
Both jobs are running. As trade messages are ingested, processed, and written to maps, the total items in and out are updated.
-
Now, select the
AggregateQueryjob to see more details, including the steps in the data pipeline.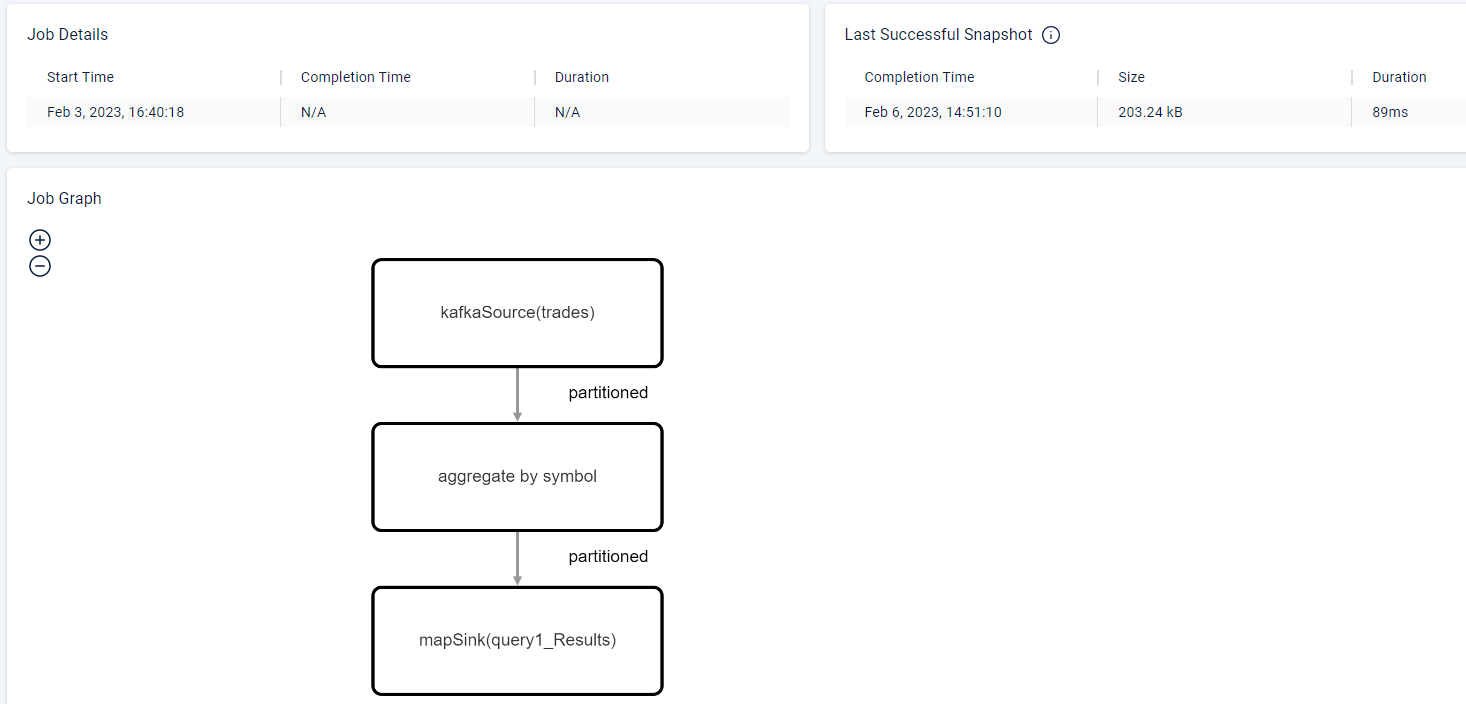
Step 8. Launch the Dashboard
In the final step, you’ll launch the trade monitor dashboard.
-
In a new terminal window, change into the
realtime-trade-monitor/directory. -
Execute the following command:
java -jar webapp/target/webapp-5.0.jar -
Open a web browser and go to
http://localhost:9000to launch the dashboard.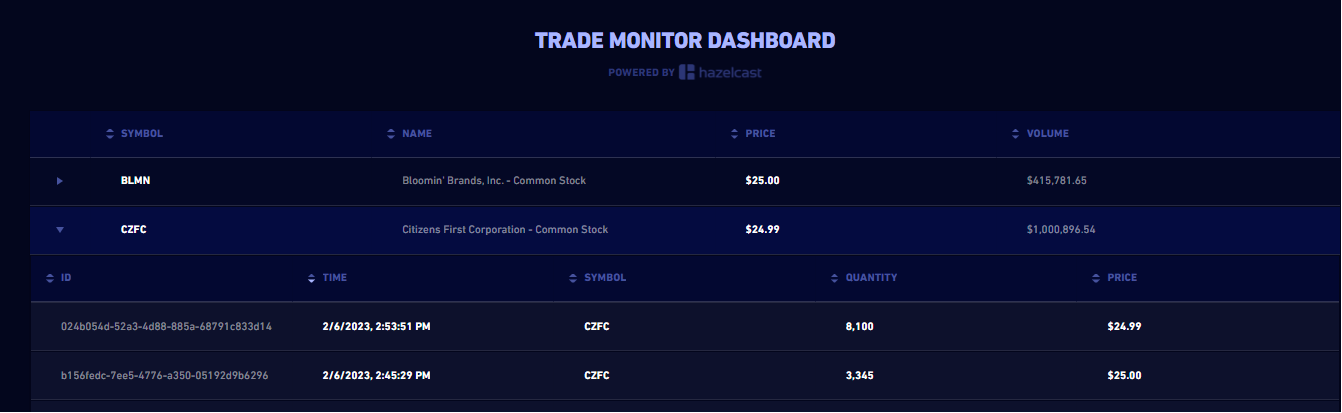
For every line in the dashboard, you can see the following details:
-
Stock name from the
symbolsmap. -
Stock price and volume from the aggregated trades data in the
query1_Resultsmap.
Expand a row to see the individual trade messages read from the
tradesmap. -
-
Finally, stop the Kafka producer by pressing Ctrl+C to close the connection to the Confluent Cloud cluster.
Summary
In this tutorial, you learned how to do the following:
-
Generate a streaming data source using a Kafka topic.
-
Query data in a map from a SQL browser.
-
Submit and view stream processing jobs on a Cloud cluster.